library(plotly)
df <- read.csv("https://raw.githubusercontent.com/plotly/datasets/master/2011_us_ag_exports.csv")
df$hover <- with(df, paste(state, '<br>', "Beef", beef, "Dairy", dairy, "<br>",
"Fruits", total.fruits, "Veggies", total.veggies,
"<br>", "Wheat", wheat, "Corn", corn))
# give state boundaries a white border
l <- list(color = toRGB("white"), width = 2)
# specify some map projection/options
g <- list(
scope = 'usa',
projection = list(type = 'albers usa'),
showlakes = TRUE,
lakecolor = toRGB('white')
)
p <- plot_geo(df, locationmode = 'USA-states') %>%
add_trace(
z = ~total.exports, text = ~hover, locations = ~code,
color = ~total.exports, colors = 'Purples'
) %>%
colorbar(title = "Millions USD") %>%
layout(
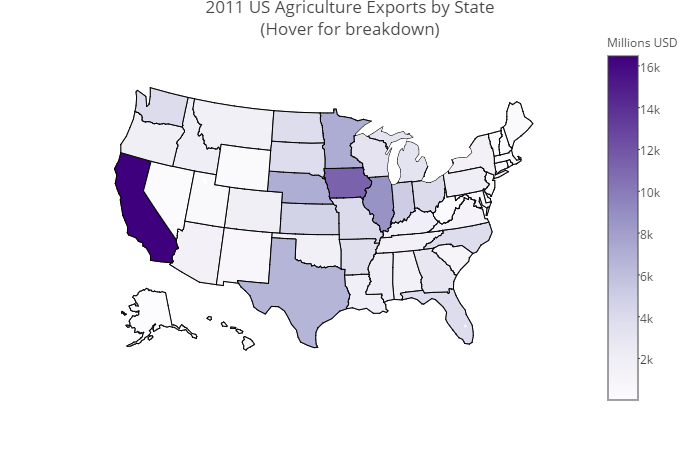
title = '2011 US Agriculture Exports by State<br>(Hover for breakdown)',
geo = g
)
p
以上代码来自plotly website生成的图应如下所示:
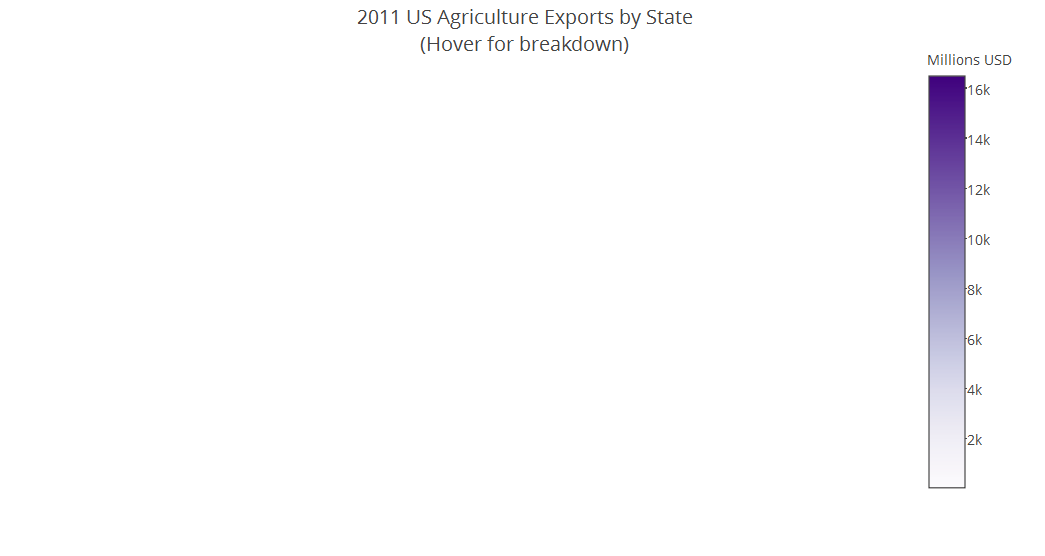
 然而,我使用代码生成的图如下:
会发生什么?我需要安装一些其他软件包才能重现正确的绘图吗?
最佳答案
我也收到了这个。如果您打开 javascript 控制台,您会看到一个错误:
Failed to load resource: Unable to init SSL Context:
当它尝试打开此文件时:
"https://cdn.plot.ly/world_110m.json"
这是屏幕截图:

原因:
我相信这是因为 R-Studio 的非专业版本在设计上不支持 https,因此除了将其包装为 markdown 并在浏览器中查看它之外,可能没有其他解决办法我在下面描述。
解决方法:
如果您将其打包在 R-markdown 中(将代码放在以下行之间):
```{r}

 (your code here)

```
然后将其另存为.Rmd文件)并编织它。那么它仍然无法在 R-Studio 预览浏览器中运行,但如果您使用“在浏览器中打开”功能并在 Chrome 中打开它(例如),它就可以运行。
或者购买专业版:)。
关于使用 R 中的plotly包再现等值区域图,我们在Stack Overflow上找到一个类似的问题: https://stackoverflow.com/questions/43458527/