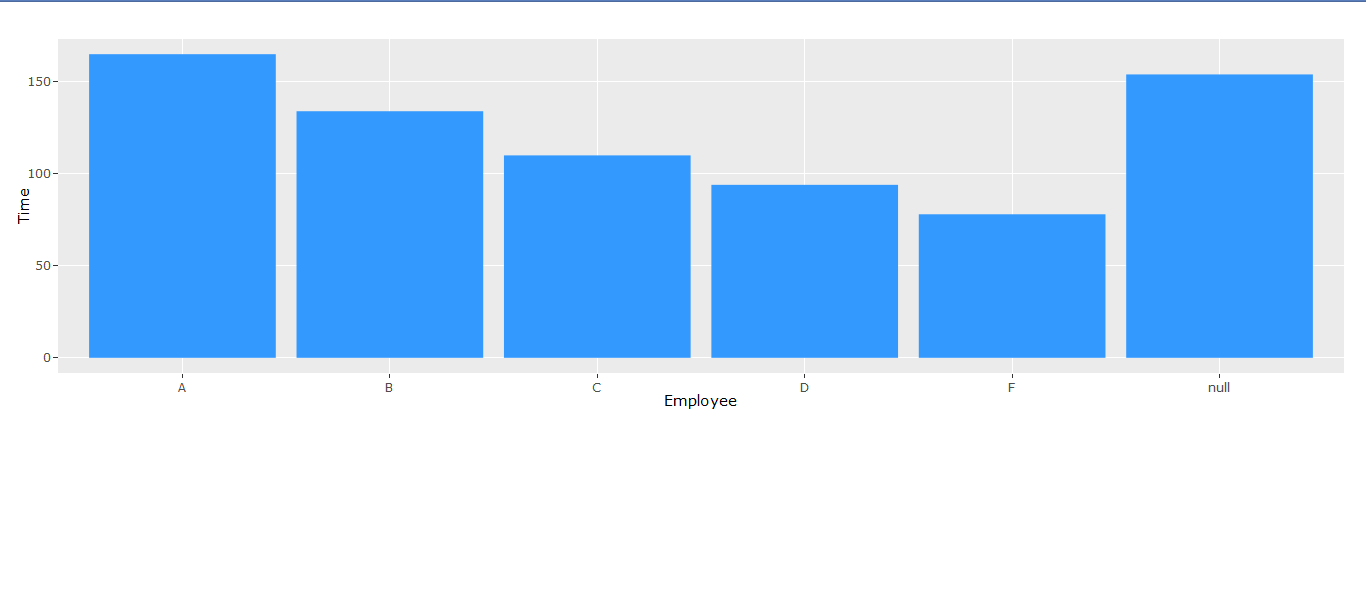
我想创建一个带有降序条形的条形图,在下面的图中,由于 NA 出现在“a1”向量的第二个位置,所以在创建图时它被推到最后。但是,我希望 NA 条仅出现在第二个位置,请在此帮助我,因为我想在不修改数据的情况下实现此目的。
library(ggplot2)
library(plotly)

a1 = c("A",NA,"B","C","D","F")
b1 = c(165,154,134,110,94,78)
a12 = data.frame(a1,b1,stringsAsFactors = FALSE)
pp1 <<- ggplot(a12 , aes(x = reorder(a1,-b1), y = b1,text=paste("User:
<br>",a1, "<br> Days: <br>", round(b1)))) +
geom_bar(stat = "identity", fill = "#3399ff" ) +
    scale_y_continuous(name = "Time") +
    scale_x_discrete(name ="Employee")
ggplotly(pp1, tooltip="text",height = 392)
最佳答案
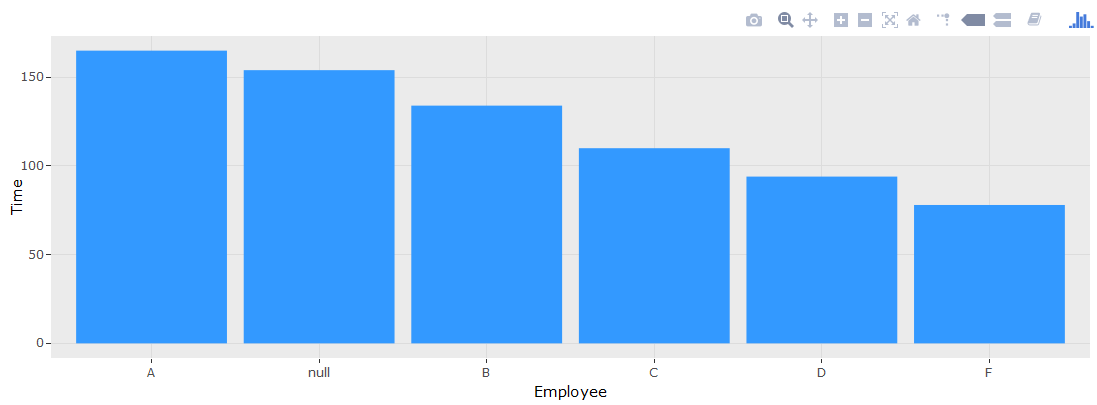
在评论中,您认为硬编码一个值来替换 NA是一种不好的做法。我想说按索引位置进行硬编码是一个坏主意,但会自动替换 NA带有字符串,例如 null ,是个好主意。
在下面的示例中,我唯一添加的是 a12$a1[is.na(a1)] <- "null" 。该行检测NA在哪里在a12$a1并将其替换为 null 。 reorder基于 b1 中的数字稍后会发生,所以这种方法不需要您知道 NA 的索引事先
library(ggplot2)
library(plotly)

a1 = c("A",NA,"B","C","D","F")
b1 = c(165,154,134,110,94,78)
a12 = data.frame(a1,b1,stringsAsFactors = FALSE)

# Replace the NA to be "null"
a12$a1[is.na(a1)] <- "null"

pp1 <- ggplot(a12 , aes(x = reorder(a1, -b1), y = b1,text=paste("User:
<br>",a1, "<br> Days: <br>", round(b1)))) +
  geom_bar(stat = "identity", fill = "#3399ff" ) +
  scale_y_continuous(name ="Time") +
  scale_x_discrete(name ="Employee")
ggplotly(pp1, tooltip="text",height = 392)
关于r - 在 R 中按降序排列带有 "null"的条形图的条形,我们在Stack Overflow上找到一个类似的问题: https://stackoverflow.com/questions/47976994/