我正在尝试在 R 中绘制表情符号和自定义图像作为 X 轴的标签。 我读过类似的帖子和 questions ,但我不想在 R 中使用 emojifont,而是使用我自己的图像作为标签 (.png),并且大约有 270 个自定义表情符号。
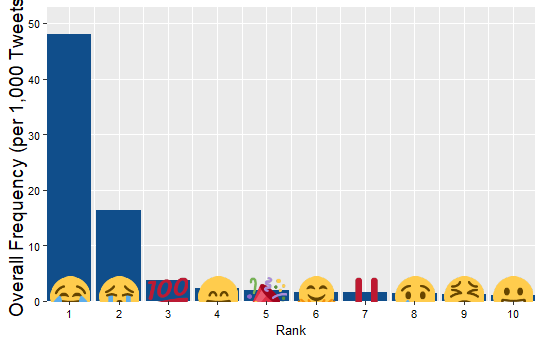
我关注了this article并设法在栏顶部显示表情符号,但我希望将表情符号作为标签。与此图像类似。

我想到的唯一解决方案是将 mapply (df.plot$dens) 中的密度值更改为 1,在此代码中:
...
mapply(function(x, y, i) {
          annotation_custom(g[[i]], xmin = x-0.5*df.plot$xsize[i], xmax = x+0.5*df.plot$xsize[i],
                            ymin = y-0.5*df.plot$ysize[i], ymax = y+0.5*df.plot$ysize[i])},
          df.plot$rank, df.plot$dens, seq_len(nrow(df.plot)))
...
因此,代码是:
g1 <- ggplot(data = df.plot, aes(x = rank, y = dens)) +
  geom_bar(stat = 'identity', fill = 'dodgerblue4') +
  xlab(xlab) + ylab(ylab) +
  mapply(function(x, y, i) {
    annotation_custom(g[[i]], xmin = x-0.5*df.plot$xsize[i], xmax = x+0.5*df.plot$xsize[i],
                      ymin = y-0.5*df.plot$ysize[i], ymax = y+0.5*df.plot$ysize[i])},
    df.plot$rank, 1, seq_len(nrow(df.plot))) +
  scale_x_continuous(expand = c(0, 0), breaks = seq(1, nrow(df.plot), 1), labels = seq(1, nrow(df.plot), 1)) +
  scale_y_continuous(expand = c(0, 0), limits = c(0, 1.10 * max(df.plot$dens))) +
  theme(panel.grid.minor.y = element_blank(),
        axis.title.x = element_text(size = 10), axis.title.y = element_text(size = 14),
        axis.text.x  = element_text(size = 8, colour = 'black'), axis.text.y  = element_text(size = 8, colour = 'black'));
g1;
结果是:
在 R 中是否可以使用 .png 作为标签而不是文本或 emojifont?
至于数据,我:
 df.plot

   description                         n  dens  rank xsize ysize
   <fct>                           <int> <dbl> <dbl> <dbl> <dbl>
 1 crying face                      1207   1.5     8  9.62  7.22
 2 double exclamation mark          1326   1.6     7  9.62  7.22
 3 face with tears of joy          39122  48.1     1  9.62  7.22
 4 grinning face                     871   1.1    10  9.62  7.22
 5 grinning face with smiling eyes  1872   2.3     4  9.62  7.22
 6 hugging face                     1401   1.7     6  9.62  7.22
 7 hundred points                   2998   3.7     3  9.62  7.22
 8 loudly crying face              13375  16.4     2  9.62  7.22
 9 party popper                     1522   1.9     5  9.62  7.22
10 tired face                        974   1.2     9  9.62  7.22
g 指的是图像:
imgs <- lapply(paste0(df.plot$description, '.png'), png::readPNG);
g <- lapply(imgs, grid::rasterGrob);
最佳答案
我找到了解决方案。 类似问题的答案在 photo alignment with graph in r 中给出和 here .
我们需要创建一个函数
my_axis = function(img) {
  structure(
    list(img=img),
    class = c("element_custom","element_blank", "element") # inheritance test workaround
  )
}
为了让它看起来更好,我建议使用 rot=45 来旋转标签
   element_grob.element_custom <- function(element, x,...)  {
  stopifnot(length(x) == length(element$img))
  tag <- names(element$img)

  # add vertical padding to leave space
  g1 <- textGrob(paste0(tag, "\n\n\n\n\n"), x=x, vjust=0.6,rot = 45)
  g2 <- mapply(rasterGrob, x=x, image=element$img[tag],
               MoreArgs=list(vjust=0.6, interpolate=FALSE,
                             height=unit(3,"lines")),
               SIMPLIFY=FALSE)
  gTree(children=do.call(gList, c(g2, list(g1))), cl="custom_axis")
}
然后调用它:
gg <- gg + theme(axis.text.x  = my_axis(pics),
                 axis.text.y  = element_text(size=14),
                 axis.title.x = element_blank())
输出:

关于r - 在 R 中的轴标签中绘制表情符号/自定义图像,我们在Stack Overflow上找到一个类似的问题: https://stackoverflow.com/questions/52493638/