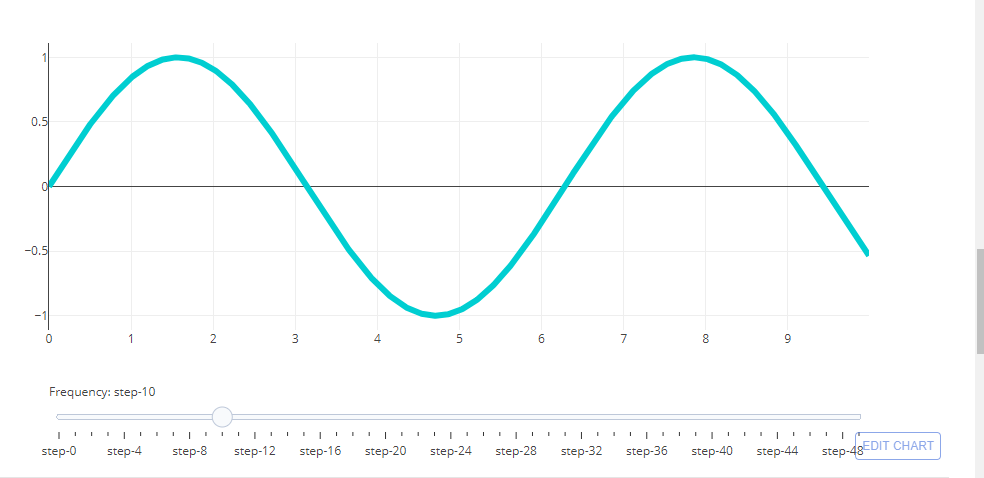
我想用 slider 重新创建这个 plotly 图:https://plot.ly/python/sliders/ 。使用 Colab 的这些说明:Plotly notebook mode with google colaboratory 。但是 slider 没有出现。
代码如下:
import numpy as np
import plotly.graph_objs as go
from plotly.offline import download_plotlyjs, init_notebook_mode, iplot

#from  https://stackoverflow.com/questions/47230817/plotly-notebook-mode-with-google-colaboratory
def configure_plotly_browser_state():
  import IPython
  display(IPython.core.display.HTML('''
        <script src="/static/components/requirejs/require.js"></script>
        <script>
          requirejs.config({
            paths: {
              base: '/static/base',
              plotly: 'https://cdn.plot.ly/plotly-1.5.1.min.js?noext',
            },
          });
        </script>
        '''))


init_notebook_mode(connected=True)

#from plotly sliders
data = [dict(
        visible = False,
        line=dict(color='#00CED1', width=6),
        name = '𝜈 = '+str(step),
        x = np.arange(0,10,0.01),
        y = np.sin(step*np.arange(0,10,0.01))) for step in np.arange(0,5,0.1)]
data[10]['visible'] = True


#configure added to visualize in colab
configure_plotly_browser_state()

steps = []
for i in range(len(data)):
    step = dict(
        method = 'restyle',
        args = ['visible', [False] * len(data)],
    )
    step['args'][1][i] = True # Toggle i'th trace to "visible"
    steps.append(step)

sliders = [dict(
    active = 10,
    currentvalue = {"prefix": "Frequency: "},
    pad = {"t": 50},
    steps = steps
)]

layout = dict(sliders=sliders)

fig = dict(data=data, layout=layout)

#removed py. from original plotly code
iplot(fig, filename='Sine Wave Slider')
代码运行并生成绘图。但是它不包括 slider 。我该如何包含它?
这是预期的输出:
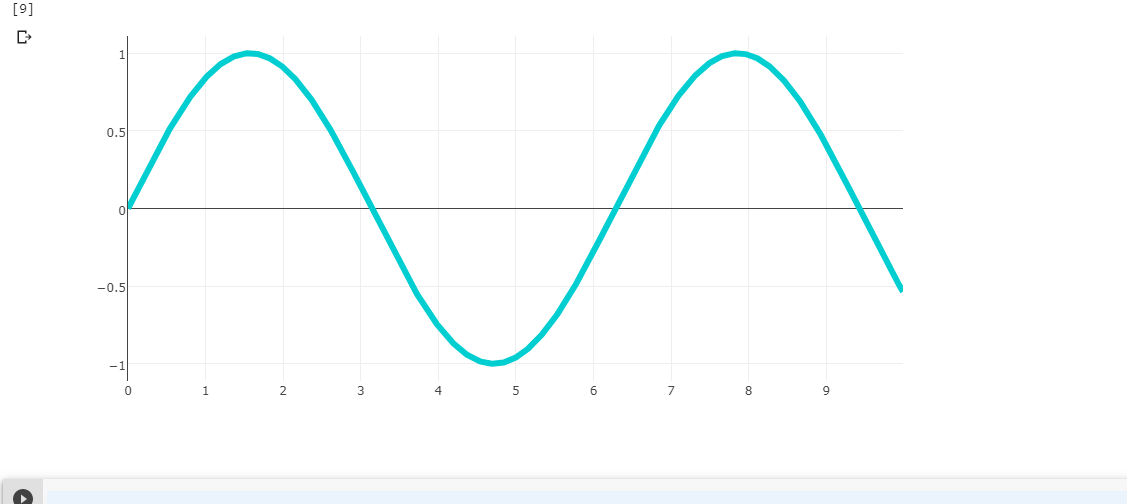
 这是没有 slider 的输出图。
最佳答案
错误在于版本不匹配。 slider 功能在 1.5.1 版本中不可用
您需要更改此特定代码行:
 paths: {
          base: '/static/base',
          plotly: 'https://cdn.plot.ly/plotly-latest.min.js?noext',
        },
为了在窗口内获得最新版本的plotly。你可以看到working demo here
关于python - 如何使用 google collaboratory 在输出中显示 Plotly slider ?,我们在Stack Overflow上找到一个类似的问题: https://stackoverflow.com/questions/56585815/