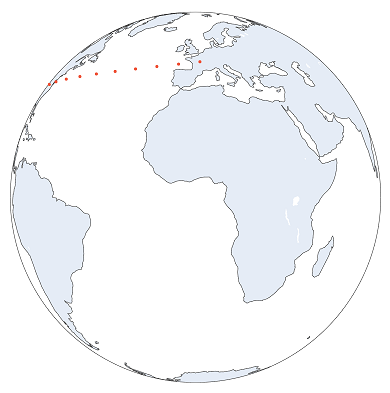
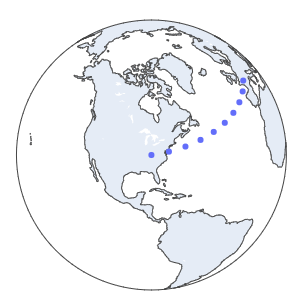
我正在使用plotly 在地球 View 上绘制一些数据。例如
import plotly.graph_objects as go
import numpy as np
fig = go.Figure(go.Scattergeo(lat=np.linspace(37.5, 47, 10),
                              lon=np.linspace(-84, 2, 10)))
fig.update_geos(projection_type='orthographic')
fig.show()
这将生成下图
我想旋转 View 以指定要“查看”的纬度/经度。例如,这可能是我关心的数据的中点。
我可以更新图形布局的哪些内容来指定要关注的纬度/经度?
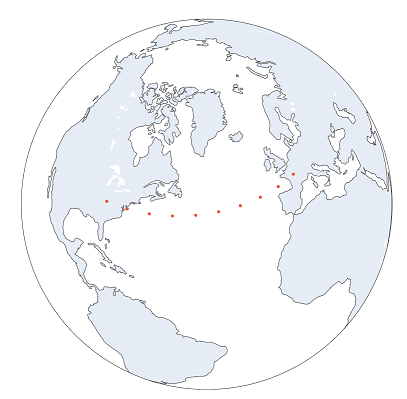
最佳答案
只需包含:
fig.update_geos(projection_rotation = {'lat': 43.83, 'lon': -36.22, 'roll': 0})
图 1:
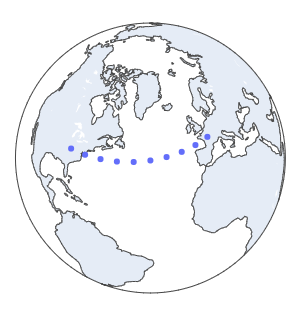
我遇到过设置这些属性会扰乱缩放的情况。例如:
fig.update_geos(projection_type='orthographic',
                projection_rotation = {'lat': 37.5, 'lon': -84, 'roll': 0},
               )
图 2
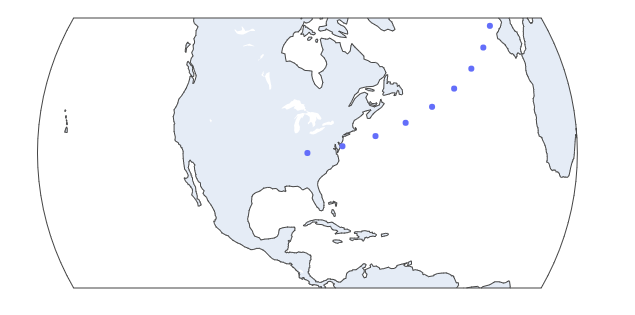
我不知道为什么,但你可以包括:
projection_scale = 0.5
你会再次得到这个:
图 3
完整代码:
import plotly.graph_objects as go
import numpy as np
fig = go.Figure(go.Scattergeo(lat=np.linspace(37.5, 47, 10),
                              lon=np.linspace(-84, 2, 10)))
f = fig.full_figure_for_development(warn=False)

fig.update_geos(projection_type='orthographic',
                projection_rotation = {'lat': 43.83, 'lon': -36.22, 'roll': 0})

fig.show()
这是使用字典的替代设置,可以避免多次重复“投影”:
fig.layout.geo.projection = {'rotation': {'lat': 37.5, 'lon': -84},
                             'scale': 0.5,
                             'type': 'orthographic'}
关于python - 将图形旋转至经纬度,我们在Stack Overflow上找到一个类似的问题: https://stackoverflow.com/questions/66373226/