我对 Altair 比较陌生,遇到了一个我似乎无法理解的问题。基本上,当我对数据进行 LOESS 拟合时,整条 LOESS 线都绘制在样本平均值以下、每个时间点的平均值以下以及回归拟合以下。
该数据是针对多个地区的月逮捕率(每 1,000 人第 2 部分犯罪)的面板数据。
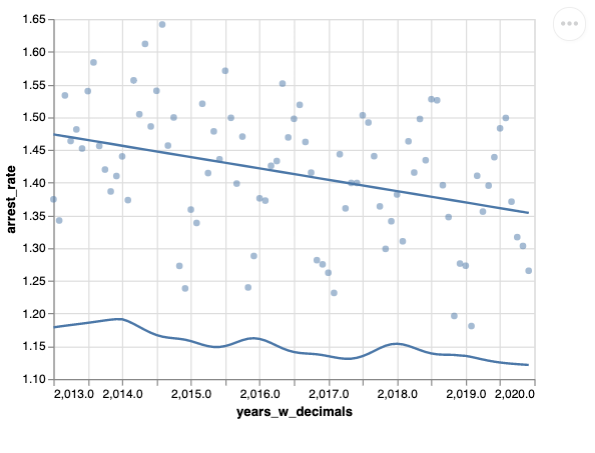
这是一个包含月平均费率、线性回归拟合和我的黄土的图。正如您所看到的,黄土远低于所有数据:
其代码是:
import pandas as pd
import altair as alt
alt.data_transformers.disable_max_rows()
# Load panel data. Monthly arrest rate (part 2 crimes per 1,000 people)
# data for number of localities.
panel = pd.read_csv(
"https://github.com/nickeubank/im_baffled/raw/main/arrest_rates.csv.zip"
)
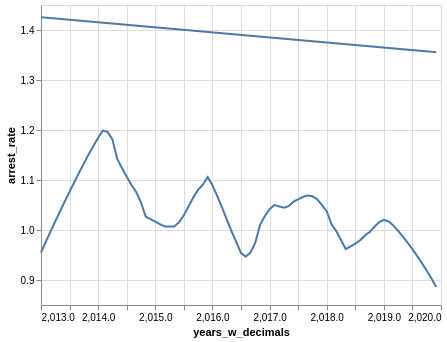
# And if I do averages for each month, I get
# a relatively smooth downward trend.
grouped_means = panel.groupby("years_w_decimals", as_index=False)[
["arrest_rate"]
].mean()
chart_grouped = (
alt.Chart(grouped_means)
.mark_circle(opacity=0.5)
.encode(
x=alt.X("years_w_decimals", scale=alt.Scale(zero=False)),
y=alt.Y("arrest_rate", scale=alt.Scale(zero=False)),
)
)
reg = (
alt.Chart(panel)
.encode(
x=alt.X("years_w_decimals", scale=alt.Scale(zero=False)),
y=alt.Y("arrest_rate", scale=alt.Scale(zero=False)),
)
.transform_regression(
"years_w_decimals",
"arrest_rate",
method="poly",
order=1,
)
.mark_line()
)
loess = (
alt.Chart(panel)
.encode(
x=alt.X("years_w_decimals", scale=alt.Scale(zero=False)),
y=alt.Y("arrest_rate", scale=alt.Scale(zero=False)),
)
.transform_loess(on="years_w_decimals", loess="arrest_rate", bandwidth=0.3)
.mark_line()
)
reg + chart_grouped + loess
任何人都可以看到出了什么问题吗?
最佳答案
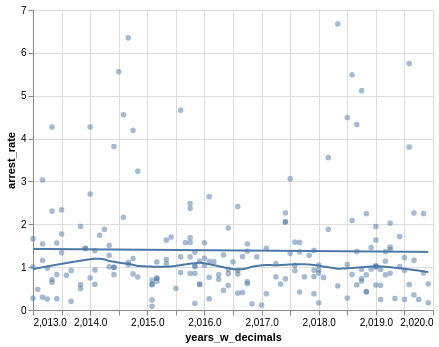
我认为发生的情况是,您有一些具有极端 y 值的点,这些点对其中一个回归计算的影响大于另一个,当您仅放大分组平均值的绘图时,如果您看到包含所有这些极值点的完整范围的图,它看起来会比实际情况有更大的差异。
panel2= panel.sample(200, random_state=200)
chart_grouped = (
    alt.Chart(panel2)
    .mark_circle(opacity=0.5)
    .encode(
        x=alt.X("years_w_decimals", scale=alt.Scale(zero=False)),
        y=alt.Y("arrest_rate", scale=alt.Scale(zero=False)),
    )
)

reg = (
    alt.Chart(panel2)
    .encode(
        x=alt.X("years_w_decimals", scale=alt.Scale(zero=False)),
        y=alt.Y("arrest_rate", scale=alt.Scale(zero=False)),
    )
    .transform_regression(
        "years_w_decimals",
        "arrest_rate",
    )
    .mark_line()
)

loess = (
    alt.Chart(panel2)
    .encode(
        x=alt.X("years_w_decimals", scale=alt.Scale(zero=False)),
        y=alt.Y("arrest_rate", scale=alt.Scale(zero=False)),
    )
    .transform_loess(
        "years_w_decimals",
        "arrest_rate",
    )
    .mark_line()
)
loess + reg
这看起来很糟糕,但是用原始点绘制完整范围使其看起来更合理。
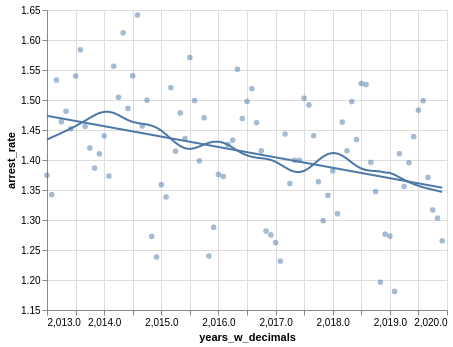
也许这里最合适的是对散点图中显示的点运行两个回归,这就是分组点的样子:
chart_grouped = (
    alt.Chart(grouped_means)
    .mark_circle(opacity=0.5)
    .encode(
        x=alt.X("years_w_decimals", scale=alt.Scale(zero=False)),
        y=alt.Y("arrest_rate", scale=alt.Scale(zero=False)),
    )
)
reg = chart_grouped.transform_regression(
        "years_w_decimals",
        "arrest_rate",
    ).mark_line()

loess = chart_grouped.transform_loess(
        "years_w_decimals",
        "arrest_rate",
    ).mark_line()

chart_grouped + loess + reg
关于python - Altair LOESS 拟合值低于平均值,远低于线性回归,我们在Stack Overflow上找到一个类似的问题: https://stackoverflow.com/questions/69111154/