给定一个连通图和一个分配了 N 个顶点的列表,我想找到一种有效的方法来创建 N 个子图,每个子图包含一个分配的顶点。 为了实现这一点,我们可以修剪边缘。但是,我们应该修剪尽可能少的边权重。
例如,让我们从下图开始。我们想要获得包含三个红色顶点之一的三个子图 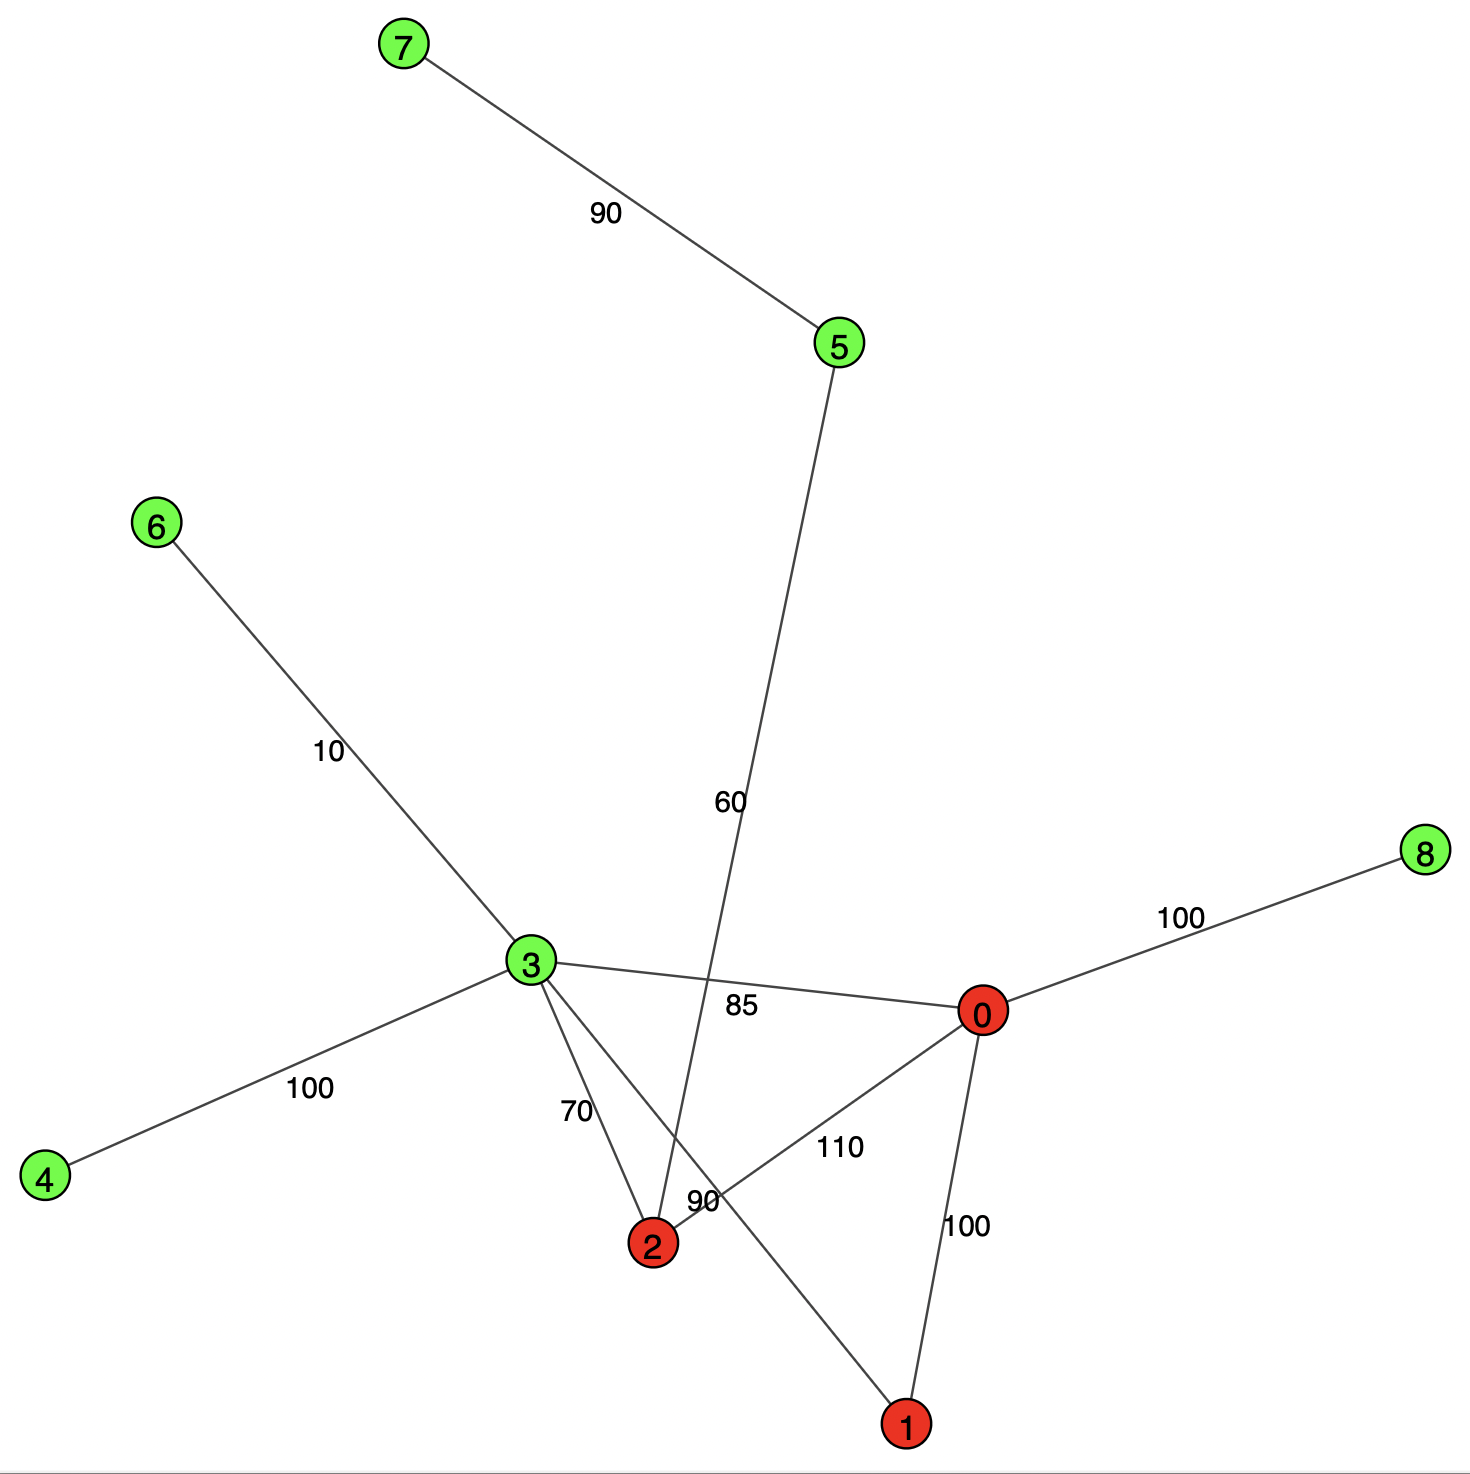
结果应如下所示:
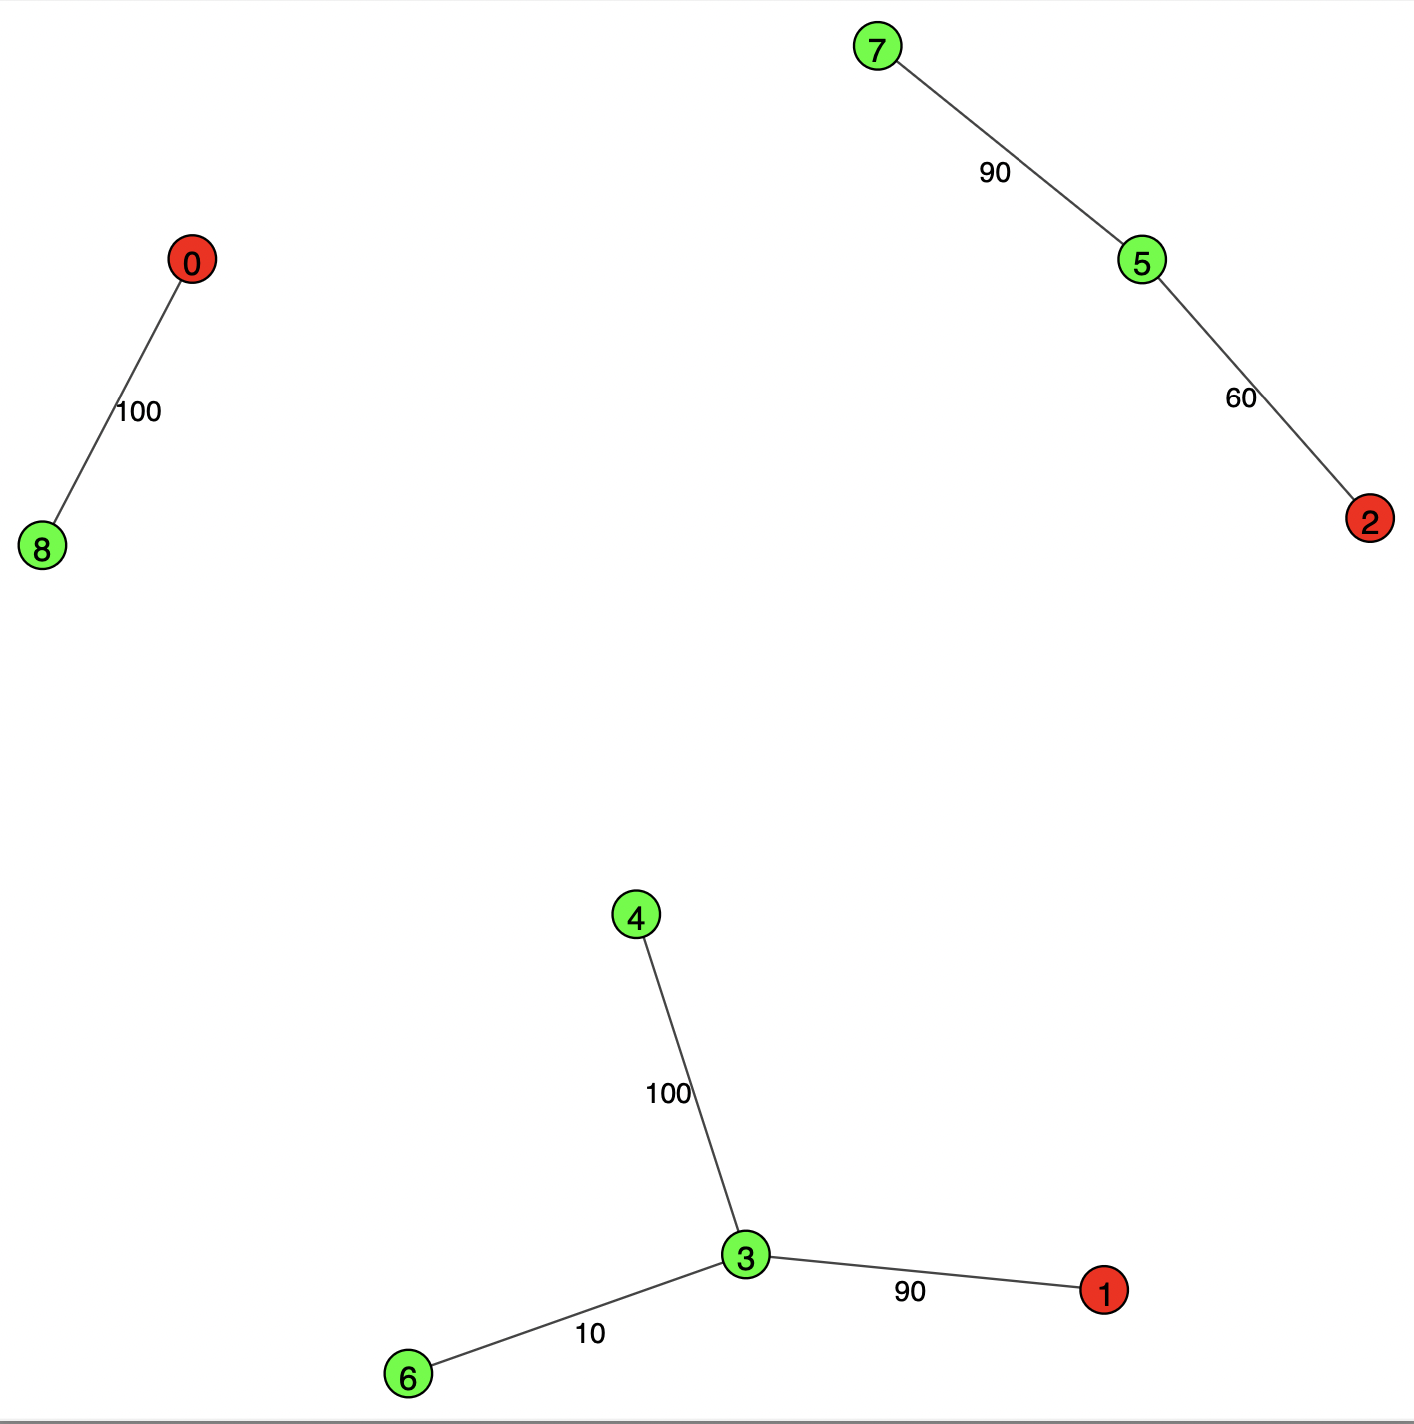
现在,我正在使用启发式方法,但它在某些边缘情况下效果不佳,并且顶点数量的复杂度为 n^2。这个想法是计算两个顶点之间的最短路径并删除最轻的边并重复直到顶点断开连接。 这是我的代码:
import pandas as pd
import igraph as ig
from collections import Counter

ucg_df = pd.DataFrame(
    [
        [0, 1, 100],
        [0, 2, 110],
        [2, 3, 70],
        [3, 4, 100],
        [3, 1, 90],
        [0, 3, 85],
        [5, 7, 90],
        [0, 8, 100],
        [3, 6, 10],
        [2, 5, 60],
    ],
    columns=["nodeA", "nodeB", "weight"],
)

ucg_graph = ig.Graph.DataFrame(ucg_df, directed=False)

ig.plot(
    ucg_graph,
    target='stack1.pdf',
    edge_label=ucg_graph.es["weight"],
    vertex_color=['red']*3 +  ['green']*(len(ucg_df)-3),
    vertex_label = ucg_graph.vs.indices
)


def generate_subgraphs_from_vertexes(g, vertex_list):
    for i, vertex in enumerate(vertex_list):
        for j in range(i + 1, len(vertex_list)):
            while True:
                path = g.get_shortest_paths(vertex_list[i], vertex_list[j], mode='ALL', output='epath',
                                     weights='weight')[0]
                if len(path) == 0:
                    break
                edge_2_drop = min(g.es[path], key=lambda x: x['weight'])
                edge_2_drop.delete()

    return g
graph = generate_subgraphs_from_vertexes(ucg_graph, ucg_graph.vs[0,1,2])


ig.plot(
    graph,
    target='stack2.pdf',
    edge_label=graph.es["weight"],
    vertex_color=['red']*3 +  ['green']*(len(ucg_df)-3),
    vertex_label = graph.vs.indices
)
我可以使用什么样的算法来更好地解决这个问题?
最佳答案
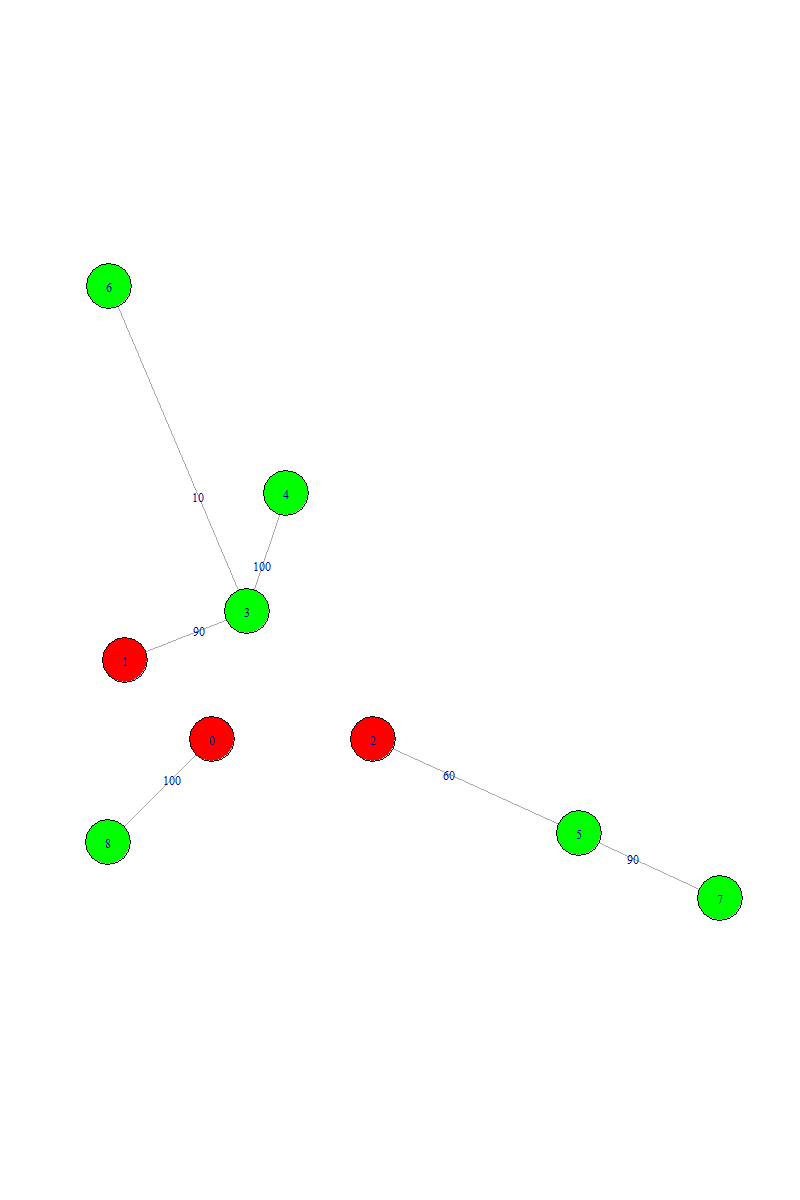
我不熟悉Python中的igraph,但下面是我在R中的尝试。希望您能在这里得到一些提示。
我认为你的问题可以重新表述为 assignment problem ,因为关键部分是将“红色”分配给关联的“绿色”顶点以最大化成本
library(igraph)
library(lpSolve)

# red vertices
vred <- V(g)[V(g)$color == "red"]

# subgraph that contains vred
sg <- induced.subgraph(
  g,
  unique(unlist(ego(g, 1, vred)))
)

# green vertices in sg
vgreen <- V(sg)[V(sg)$color == "green"]

# cost matrix
cost.mat <- get.adjacency(sg, attr = "label", sparse = FALSE)[vred, ][, vgreen]
p <- lp.assign(cost.mat, "max")
idx <- which(p$solution > 0, arr.ind = TRUE)
# edge list for max assignment
el1 <- cbind(names(vred[idx[, 1]]), names(vgreen[idx[, 2]]))

# all edges associated with vred
el <- get.edgelist(g)
el2 <- el[rowSums(matrix(el %in% names(vred), ncol = 2)) > 0, ]

# remove edges that are not obtained for the max assignment
rmEls <- do.call(
  paste,
  c(
    data.frame(
      el2[!apply(el2, 1, function(x) toString(sort(x))) %in% apply(el1, 1, function(x) toString(sort(x))), ]
    ),
    sep = "|"
  )
)
out <- g %>%
  delete.edges(rmEls)
当运行plot(out,layout =layout_nicely(g))时,你会看到
数据
df <- data.frame(
  from = c(0, 0, 2, 3, 3, 0, 5, 0, 3, 2),
  to = c(1, 2, 3, 4, 1, 3, 7, 8, 6, 5),
  weight = c(100, 110, 70, 100, 90, 85, 90, 100, 10, 60)
)

# original graph object
g <- df %>%
  graph_from_data_frame(directed = FALSE) %>%
  set_edge_attr(name = "label", value = df$weight) %>%
  set_vertex_attr(name = "color", value = ifelse(names(V(.)) %in% c("0", "1", "2"), "red", "green"))
关于python - 在最大化边权重的同时断开图的有效方法,我们在Stack Overflow上找到一个类似的问题: https://stackoverflow.com/questions/74854464/