虽然我已经使用jointJs很长时间了,但我仍然有一个问题。我需要使用线条绘制自定义形状。我使用以下代码绘制一个矩形:
joint.V(MyPaper.viewport).append(joint.V("rect", { x: 145, y: 70, width: 260, height: 70 }));
有什么方法可以绘制弯曲的矩形和自定义形状吗?
最佳答案
技巧是使用 path 标签作为示例。有了这个你就可以画任何你想要的东西。 SVG 文件也使用它。 documentation这是良好的第一步。
代码
// Import stylesheets
import "./style.css";
import * as joint from "jointjs";

var graph = new joint.dia.Graph();
new joint.dia.Paper({
  el: document.getElementById("app"),
  width: 800,
  height: 600,
  model: graph,
  interactive: { linkMove: false },
  defaultConnectionPoint: {
    name: "boundary",
    args: {
      extrapolate: true,
      sticky: true
    }
  },
  validateConnection: function() {
    return false;
  }
});

// Custom Link

var link = new joint.dia.Link({
  markup: [
    {
      tagName: "path",
      selector: "p1"
    },
    {
      tagName: "circle",
      selector: "c1"
    },
    {
      tagName: "path",
      selector: "p2"
    },
    {
      tagName: "circle",
      selector: "x"
    }
  ],
  source: { x: 20, y: 20 },
  target: { x: 300, y: 280 },
  vertices: [{ x: 150, y: 280 }],
  attrs: {
    p1: {
      connection: true,
      fill: "none",
      stroke: "black",
      strokeWidth: 6,
      strokeLinejoin: "round"
    },
    p2: {
      connection: true,
      fill: "none",
      stroke: "#fe854f",
      strokeWidth: 4,
      pointerEvents: "none",
      strokeLinejoin: "round",
      targetMarker: {
        type: "path",
        fill: "#fe854f",
        stroke: "black",
        "stroke-width": 1,
        d: "M 10 -3 10 -10 -2 0 10 10 10 3"
      }
    },
    x: {
      r: 10,
      stroke: "black",
      fill: "#fe854f",
      atConnectionRatio: 0.1,
      strokeWidth: 1,
      event: "myclick:circle",
      opacity: 0
    }
  }
});

graph.resetCells([link]);

window.addEventListener("click", () => {
  console.log(link.prop("markup"));
  link.set(
    "markup",
    link.prop("markup").concat({
      tagName: "circle",
      selector: "x1"
    })
  );
  // link.attr("attrs/x/display", "block");
  times(3, async () => {
    link.transition("attrs/x/opacity", 1, { duration: 100 });
    const duration = 1250;
    link.transition("attrs/x/atConnectionRatio", 0.9, { duration });
    await delay(duration - 100);
    link.transition("attrs/x/opacity", 0, { duration: 100 });
    await delay(100);
    link.transition("attrs/x/atConnectionRatio", 0.1, { duration: 0 });
    await delay(50);
  });
});

async function times(count: number, fn: () => Promise<void>): Promise<void> {
  let index = 0;
  while (index < count) {
    await fn();
    index++;
  }
}

function delay(ms: number): Promise<void> {
  return new Promise(resolve => setTimeout(resolve, ms));
}
HTML
<div id="app"></div>
Here一切尽在 Stackblitz。
结果:
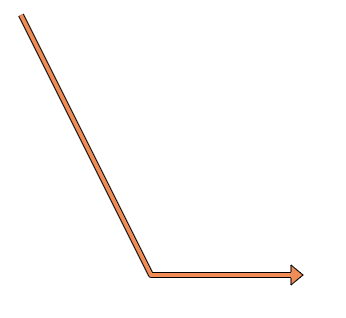
像这样画你的包(对不起......又快又脏)
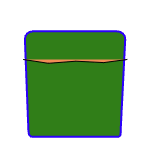
我使用这个代码:
// Import stylesheets
import './style.css';
import * as joint from 'jointjs';

var graph = new joint.dia.Graph();
new joint.dia.Paper({
  el: document.getElementById('app'),
  width: 800,
  height: 600,
  model: graph,
  interactive: { linkMove: false },
  defaultConnectionPoint: {
    name: 'boundary',
    args: {
      extrapolate: true,
      sticky: true,
    },
  },
  validateConnection: function () {
    return false;
  },
});

// Custom Link

var link = new joint.dia.Link({
  markup: [
    {
      tagName: 'path',
      selector: 'p1',
    },
    {
      tagName: 'path',
      selector: 'p2',
    },
  ],
  source: { x: 50, y: 0 },
  target: { x: 0, y: 0 },

  attrs: {
    p1: {
      connection: true,
      fill: 'none',
      strokeWidth: 6,
      strokeLinejoin: 'round',
      targetMarker: {
        type: 'path',
        fill: 'green',
        stroke: 'blue',
        'stroke-width': 2,
        d: 'm 50.896114,64.34417 h 84.321566 c 4.432,0 8.22239,3.573583 8,8 l -4.49717,89.5106 c -0.22239,4.42642 0.92917,8 -3.50283,8 H 50.896114 c -4.432,0 -4.369478,-3.57131 -4.540636,-8 l -3.459364,-89.5106 c -0.171158,-4.428694 3.568,-8 8,-8 z',
      },
    },
    p2: {
      connection: true,
      fill: 'none',
      stroke: 'pink',
      strokeWidth: 0,
      pointerEvents: 'none',
      strokeLinejoin: 'round',
      targetMarker: {
        type: 'path',
        fill: '#fe854f',
        stroke: 'black',
        'stroke-width': 1,
        d: 'm 41.133796,92.45404 25.218478,3.843799 27.541231,-2.096617 27.873045,1.397745 23.55937,-3.144927',
      },
    },
  },
});

graph.resetCells([link]);
这是更新后的Stackblitz .
关于javascript - 绘制自定义形状和弯曲矩形,我们在Stack Overflow上找到一个类似的问题: https://stackoverflow.com/questions/74918210/