目前我有一个 X Y 坐标的数据框,它代表 OpenCV Python 中检测到的一些圆圈。这些圆圈形成不同的行和列,我想将它们逐行聚集。

但是,有时这些坐标会稍微旋转,如下所示。旋转可以是顺时针和逆时针。
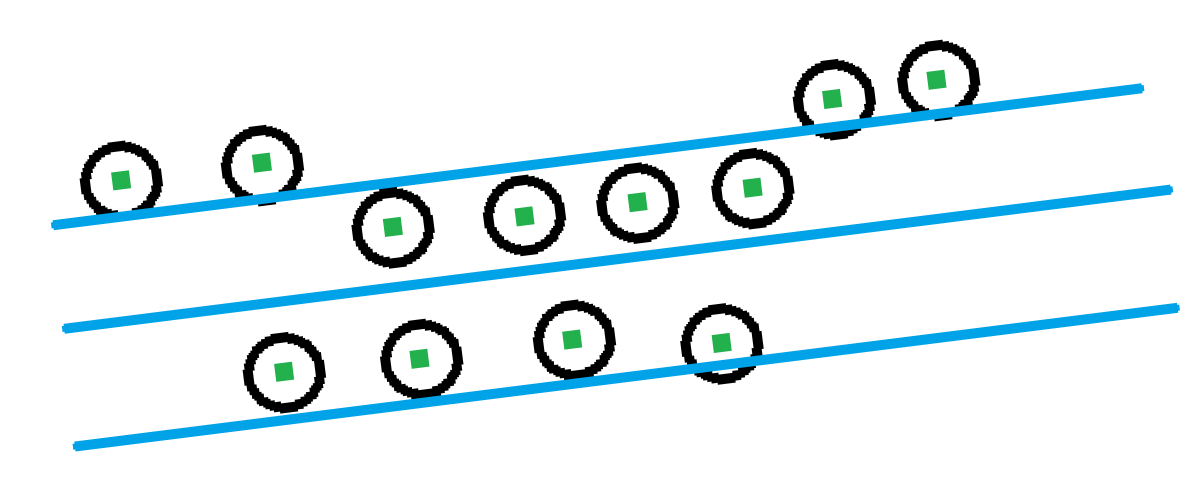
将这些坐标逐行分组在一起的最简单方法是什么?
这是一个示例数据框:
sample=pd.DataFrame({
 'X_center': {72: 0.098054,
  137: 0.112574,
  254: 0.14442,
  322: 0.113445,
  365: 0.113445,
  370: 0.188365,
  384: 0.158165,
  386: 0.173459,
  401: 0.040267,
  405: 0.128303,
  408: 0.128352,
  415: 0.174039,
  451: 0.187688,
  454: 0.159326,
  482: 0.158213,
  500: 0.024828,
  519: 0.010309,
  603: 0.08489,
  606: 0.188946,
  613: 0.128932,
  684: 0.114026,
  688: 0.141709,
  717: 0.172878,
  738: 0.143113,
  816: 0.054787,
  824: 0.157778,
  841: 0.187639,
  876: 0.069064,
  890: 0.128448,
  908: 0.024247,
  937: 0.186865,
  939: 0.083293,
  964: 0.069306,
  974: 0.098587,
  976: 0.158794,
  1035: 0.171474,
  1037: 0.084842,
  1097: 0.143016,
  1100: 0.159181,
  1106: 0.054835,
  1111: 0.173652,
  1189: 0.114413,
  1199: 0.113639,
  1209: 0.025312,
  1214: 0.084067,
  1283: 0.156326,
  1313: 0.127142,
  1447: 0.099313,
  1494: 0.142145,
  1535: 0.083922,
  1557: 0.174426,
  1580: 0.172733,
  1607: 0.114413,
  1618: 0.039009,
  1626: 0.055609,
  1820: 0.0997,
  1866: 0.043945,
  1877: 0.070322,
  1890: 0.084842,
  1909: 0.128448,
  1951: 0.173217,
  1952: 0.144275,
  1978: 0.052221,
  1988: 0.112235,
  2002: 0.127384,
  2063: 0.009825,
  2106: 0.129174,
  2113: 0.005033,
  2137: 0.158939,
  2182: 0.010357},
 'Y_center': {72: 0.118009,
  137: 0.101591,
  254: 0.197024,
  322: 0.118112,
  365: 0.150077,
  370: 0.148589,
  384: 0.117599,
  386: 0.148999,
  401: 0.199025,
  405: 0.117137,
  408: 0.13371,
  415: 0.180605,
  451: 0.116983,
  454: 0.196614,
  482: 0.13335,
  500: 0.060595,
  519: 0.198923,
  603: 0.18235,
  606: 0.1804,
  613: 0.165623,
  684: 0.165829,
  688: 0.054284,
  717: 0.117394,
  738: 0.118266,
  816: 0.182863,
  824: 0.101796,
  841: 0.085428,
  876: 0.150539,
  890: 0.149615,
  908: 0.038122,
  937: 0.053207,
  939: 0.118676,
  964: 0.166855,
  974: 0.150077,
  976: 0.149666,
  1035: 0.037917,
  1037: 0.166496,
  1097: 0.149359,
  1100: 0.165469,
  1106: 0.166496,
  1111: 0.164802,
  1189: 0.181632,
  1199: 0.133915,
  1209: 0.18312,
  1214: 0.134582,
  1283: 0.038019,
  1313: 0.102258,
  1447: 0.166034,
  1494: 0.086455,
  1535: 0.150128,
  1557: 0.196408,
  1580: 0.101539,
  1607: 0.197383,
  1618: 0.120062,
  1626: 0.198102,
  1820: 0.197435,
  1866: 0.038481,
  1877: 0.198102,
  1890: 0.197281,
  1909: 0.08589,
  1951: 0.133043,
  1952: 0.181683,
  1978: 0.087276,
  1988: 0.039251,
  2002: 0.054797,
  2063: 0.15136,
  2106: 0.197075,
  2113: 0.082555,
  2137: 0.181016,
  2182: 0.167317}}
最佳答案
已经太晚了,您现在应该已经找到解决方案了。但希望我的回答对你有用。
如果“稍微旋转”是指示例中发生的情况,不用担心,即使 k-means 也可以很好地处理它。我用了silhouette score找到簇的数量,结果似乎是正确的:
import math
from sklearn.cluster import KMeans
from sklearn import metrics
from getSample import getSample

x, y = getSample() # gets coordinates of points in numpy arrays
maxScore = -math.inf
for k in range(2, 21):
    model = KMeans(n_clusters=k)
    C = model.fit(y.reshape(-1, 1))
    score = metrics.silhouette_score(
        y.reshape(-1, 1), C.labels_.astype(float), metric='euclidean')
    if score > maxScore:
        maxScore = score
        bestC = C
print(bestC.n_clusters)
print(bestC.cluster_centers_) # y-intercept of horizontal lines, each representing a layer
10
[0.038358   0.05572075 0.0855208  0.101796   0.11802644 0.13372
 0.1498409  0.16610233 0.18170863 0.19757927]

但是当旋转角度太大以致于各层在 y 跨度上重叠时,就会出现问题。在这种情况下,我们首先要确定旋转的角度。我建议这样的算法:
- 查找集合中点的所有 2 组合
- 计算每对点之间的向量
- 仅保留 x 分量大于 y 分量的向量
- 按向量大小排序
- 从最小向量中选择总点数的百分之二十
- 反转 x 分量为负的向量
- 求向量与 x 轴的平均角度
这样就找到了多个彼此最接近的一对点,它们分别位于彼此的左右两侧,并从左边的点到右边的点的方向形成一个向量。这些向量很可能处于同一方向并显示各层的方向。
x, y = getSample(rotation=a)

iPairs = range(len(x))
pairs = np.array(list(itertools.combinations(iPairs, 2)))

vx = x[pairs[:, 0]]-x[pairs[:, 1]]
vy = y[pairs[:, 0]]-y[pairs[:, 1]]

hClose = np.abs(vx) > np.abs(vy)
vx = vx[hClose]
vy = vy[hClose]

mag = np.sqrt(np.square(vx) + np.square(vy))
iClosest = np.argsort(mag)[:int(len(x)*.2)]
vx = vx[iClosest]
vy = vy[iClosest]

iFlip = vx<0.0
vx[iFlip] = -vx[iFlip]
vy[iFlip] = -vy[iFlip]

layerSlope = np.mean(vy) / np.mean(vx)

a2 = math.atan2(np.mean(vy), np.mean(vx))
print("Error: %.1f°"%(math.degrees(abs(a-a2))))
如果与提供的示例相反,层的点之间的距离可能不相等,则必须在求平均值之前对向量进行归一化。
找到各层的斜率后,其余工作与不旋转的情况相同。唯一的区别是,这次不是在点的 y 分量上进行聚类,而是在距经过原点且斜率等于找到值的直线的垂直距离上进行聚类。
y2 = y - layerSlope * x

关于python - 如何使用 Y 轴值将坐标值聚集到行中?,我们在Stack Overflow上找到一个类似的问题: https://stackoverflow.com/questions/75208601/