我正在学习一些将其与 HTML/JavaScript 混合的 plotly 知识,因此我使用 plotly.js CDN
我假装将一组随机生成的点绘制到X、Y和Z坐标空间中,我已经成功生成了所有点,但我遇到了一个问题,试图在同一绘图中将所有三个坐标轴显示为引用平面......
我已经成功地显示了XY平面和点
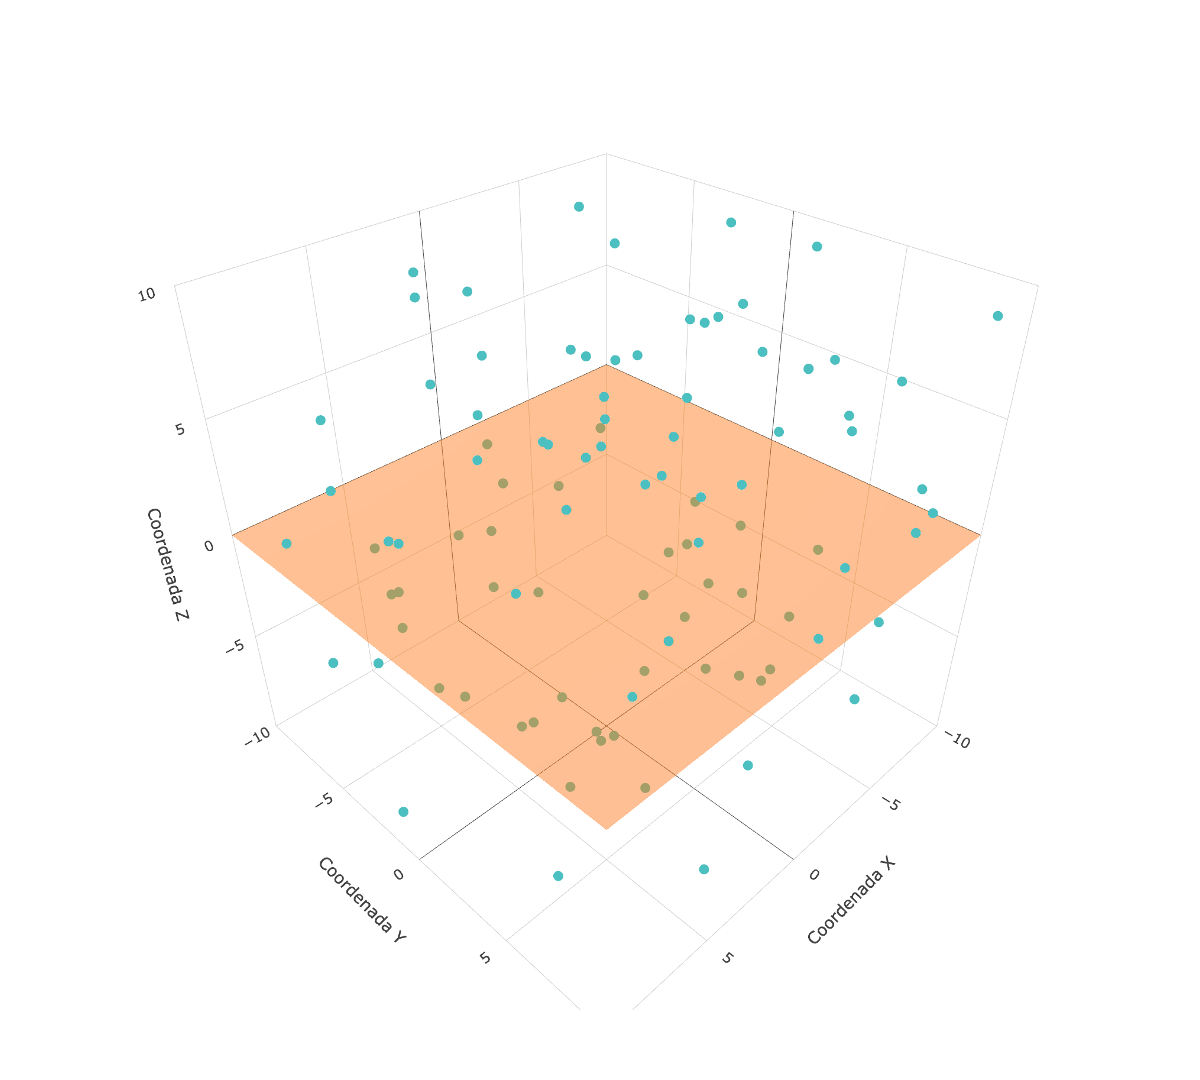
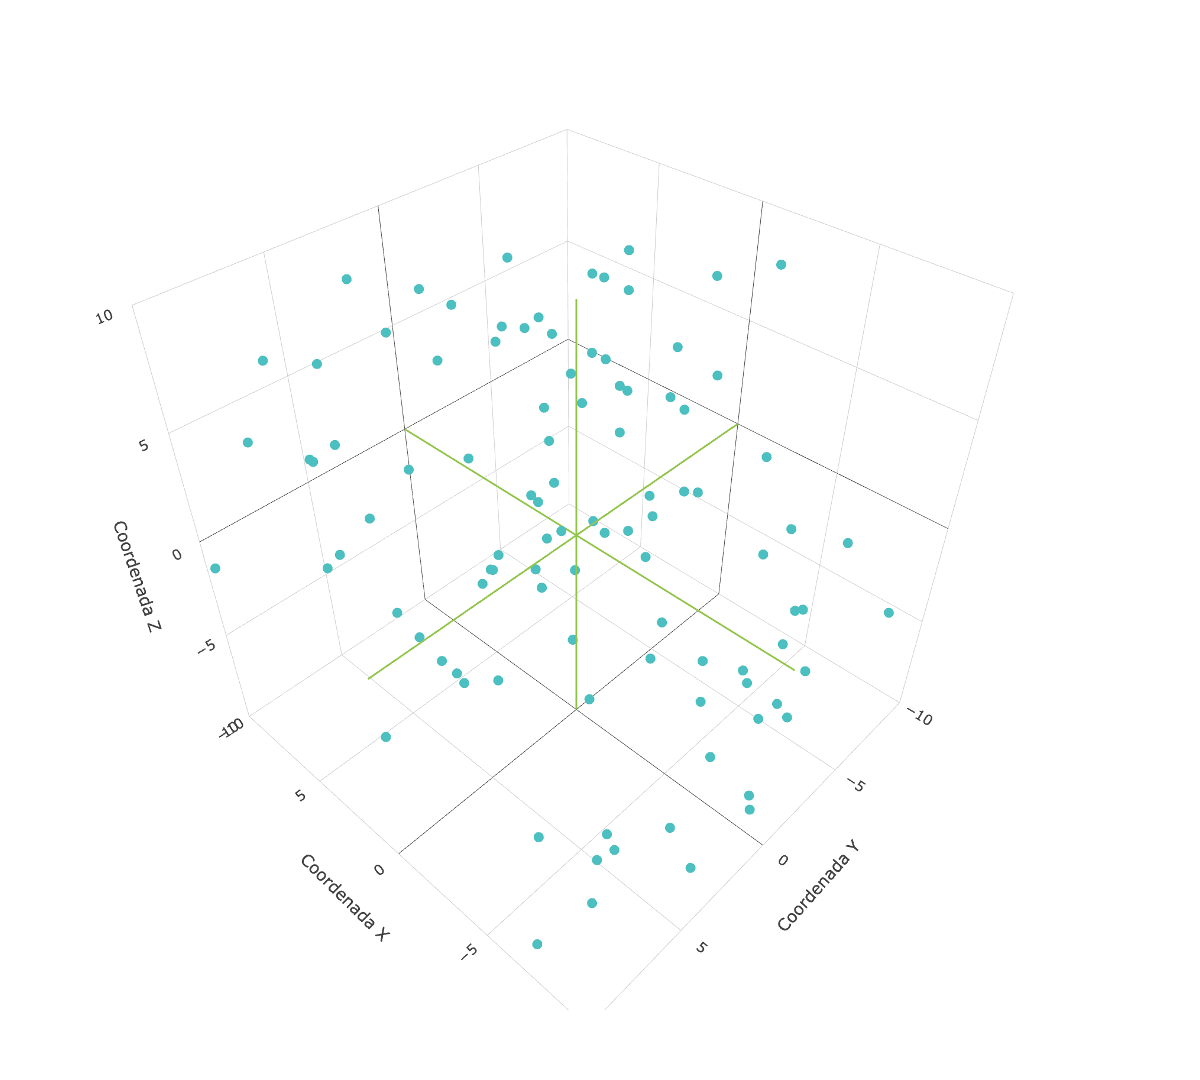
但我仍然无法像我所做的那样显示 XZ 和 YZ 引用平面在这里但有线条
我什至尝试使用chatGPT,但在尝试解决问题时完全失败了......
这里分享我正在使用的整个JS脚本代码,希望有人可以帮助我!!!!
<script>
    // Array to store the generated points
    const dots = [];

    // Generate 100 points with random x, y, z coordinates
    for (let i = 0; i < 100; i++) {
      const x = Math.random() * 20 - 10;
      const y = Math.random() * 20 - 10;
      const z = Math.random() * 20 - 10;
      dots.push({ x, y, z });
    }

    // Extract x, y, and z coordinates separately for the chart
    const xData = dots.map(point => point.x);
    const yData = dots.map(point => point.y);
    const zData = dots.map(point => point.z);

    // Configure the 3D chart trace
    const trace = {
      x: xData,
      y: yData,
      z: zData,
      mode: 'markers',
      marker: {
        size: 5,
        color: 'rgb(75, 192, 192)',
      },
      type: 'scatter3d',
    };

    // Plane x-y (z = 0)
    const dataPlaneXY = {
        x: [-10, 10, 10, -10],
        y: [-10, -10, 10, 10],
        z: [0, 0, 0, 0],
        type: 'mesh3d',
        colorscale: 'Viridis',
        opacity: 0.5,
        lighting: {
            specular: 0.2,
            ambient: 0.8,
            diffuse: 0.5,
            fresnel: 0.2,
        },
    };

    // Plane x-z (y = 0)
    const dataPlaneXZ = {
        x: [-10, 10, 10, -10],
        y: [0, 0, 0, 0],
        z: [-10, -10, 10, 10],
        type: 'mesh3d',
        colorscale: 'Viridis',
        opacity: 0.5,
        lighting: {
            specular: 0.2,
            ambient: 0.8,
            diffuse: 0.5,
            fresnel: 0.2,
        },
    };

    // Plane y-z (x = 0)
    const dataPlaneYZ = {
        x: [0, 0, 0, 0],
        y: [-10, 10, 10, -10],
        z: [-10, -10, 10, 10],
        type: 'mesh3d',
        colorscale: 'Viridis',
        opacity: 0.5,
        lighting: {
            specular: 0.2,
            ambient: 0.8,
            diffuse: 0.5,
            fresnel: 0.2,
        },
    };

    // Data for the chart, including the lines for the reference planes
    const data = [trace, dataPlaneXY, dataPlaneXZ, dataPlaneYZ];

    // Configure the layout of the 3D chart
    const layout = {
      scene: {
        xaxis: { title: 'X Coordinate', range: [-10, 10], showaxeslines: true },
        yaxis: { title: 'Y Coordinate', range: [-10, 10], showaxeslines: true },
        zaxis: { title: 'Z Coordinate', range: [-10, 10], showaxeslines: true },
        aspectmode: 'cube', //  ensures the axes have the same scale
        showaxeslines: true, // Show axis lines
      },
    };
    // Draw the 3D chart
    Plotly.newPlot('coordinateChart', data, layout);
  </script>
非常感谢@kikon的回答(请阅读!!!)
如果有人对他的回答结果感兴趣

最佳答案
mesh3d 是一组三 Angular 形;属性x、y和z指定一组点;还必须指定如何将这些点分组为三 Angular 形。
最安全、最清晰的方法是设置属性 i 、j 和 k。
如果一组:
i: [0, 1],
j: [1, 2],
k: [2, 3],
将有两个三 Angular 形:第一个由点 0,1,2 形成,第二个由点 1,2,3 形成 - 坐标取自 x,y,z 数组。
这是一个基于该解决方案的解决方案(请注意,我还更改了两个坐标的顺序):
const dots = [];

// Generate 100 points with random x, y, z coordinates
for (let i = 0; i < 100; i++) {
   const x = Math.random() * 20 - 10;
   const y = Math.random() * 20 - 10;
   const z = Math.random() * 20 - 10;
   dots.push({ x, y, z });
}

// Extract x, y, and z coordinates separately for the chart
const xData = dots.map(point => point.x);
const yData = dots.map(point => point.y);
const zData = dots.map(point => point.z);

// Configure the 3D chart trace
const trace = {
   x: xData,
   y: yData,
   z: zData,
   mode: 'markers',
   marker: {
      size: 5,
      color: 'rgb(75, 192, 192)',
   },
   type: 'scatter3d',
};

// Plane x-y (z = 0)
const dataPlaneXY = {
   x: [-10, 10, -10, 10],
   y: [-10, -10, 10, 10],
   z: [0, 0, 0, 0],
   i: [0, 1],
   j: [1, 2],
   k: [2, 3],
   type: 'mesh3d',
   colorscale: 'Viridis',
   opacity: 0.5,
   lighting: {
      specular: 0.2,
      ambient: 0.8,
      diffuse: 0.5,
      fresnel: 0.2,
   },
};

// Plane x-z (y = 0)
const dataPlaneXZ = {
   x: [-10, 10, -10, 10],
   y: [0, 0, 0, 0],
   z: [-10, -10, 10, 10],
   i: [0, 1],
   j: [1, 2],
   k: [2, 3],
   type: 'mesh3d',
   colorscale: 'Viridis',
   opacity: 0.5,
   lighting: {
      specular: 0.2,
      ambient: 0.8,
      diffuse: 0.5,
      fresnel: 0.2,
   },
};

// Plane y-z (x = 0)
const dataPlaneYZ = {
   x: [0, 0, 0, 0],
   y: [-10, 10, -10, 10],
   z: [-10, -10, 10, 10],
   i: [0, 1],
   j: [1, 2],
   k: [2, 3],
   type: 'mesh3d',
   colorscale: 'Viridis',
   opacity: 0.5,
   lighting: {
      specular: 0.2,
      ambient: 0.8,
      diffuse: 0.5,
      fresnel: 0.2,
   },
};

// Data for the chart, including the lines for the reference planes
const data = [trace, dataPlaneXY, dataPlaneXZ, dataPlaneYZ];

// Configure the layout of the 3D chart
const layout = {
   scene: {
      xaxis: { title: 'X Coordinate', range: [-10, 10], showaxeslines: true },
      yaxis: { title: 'Y Coordinate', range: [-10, 10], showaxeslines: true },
      zaxis: { title: 'Z Coordinate', range: [-10, 10], showaxeslines: true },
      aspectmode: 'cube', //  ensures the axes have the same scale
      showaxeslines: true, // Show axis lines
   },
};
// Draw the 3D chart
Plotly.newPlot('coordinateChart', data, layout);
<div id='coordinateChart' style="height:450px; width:100%"></div>
<script src="https://cdnjs.cloudflare.com/ajax/libs/plotly.js/2.24.3/plotly.min.js" integrity="sha512-OB3KqMv8ZelkEhNOv1J6PB0aYRkn8oota0+LoGXIVD3hv1Pu9ebxFJXBopRlGkYLTLEUM7aX9zBepBzGcZzH5A==" crossorigin="anonymous" referrerpolicy="no-referrer"></script>现在,提供替代解决方案,并解释为什么 xy 平面在没有 i、j、k 的情况下工作:未指定它们,则使用 Delaunay 三 Angular 剖分 - 请参阅 alphahull 上的文档和 delaunayaxis属性。
因此,事实证明,至少对于 4 个共面点,Delaunay 三 Angular 剖分工作得很好,但您必须将 delaunayaxis 设置为垂直于其平面的轴。是的,默认值是 z,这就是为什么它在没有添加 xy 平面的情况下工作的原因:
const dots = [];

// Generate 100 points with random x, y, z coordinates
for (let i = 0; i < 100; i++) {
   const x = Math.random() * 20 - 10;
   const y = Math.random() * 20 - 10;
   const z = Math.random() * 20 - 10;
   dots.push({ x, y, z });
}

// Extract x, y, and z coordinates separately for the chart
const xData = dots.map(point => point.x);
const yData = dots.map(point => point.y);
const zData = dots.map(point => point.z);

// Configure the 3D chart trace
const trace = {
   x: xData,
   y: yData,
   z: zData,
   mode: 'markers',
   marker: {
      size: 5,
      color: 'rgb(75, 192, 192)',
   },
   type: 'scatter3d',
};

// Plane x-y (z = 0)
const dataPlaneXY = {
   x: [-10, 10, 10, -10],
   y: [-10, -10, 10, 10],
   z: [0, 0, 0, 0],
   delaunayaxis: 'z', //default
   type: 'mesh3d',
   colorscale: 'Viridis',
   opacity: 0.5,
   lighting: {
      specular: 0.2,
      ambient: 0.8,
      diffuse: 0.5,
      fresnel: 0.2,
   },
};

// Plane x-z (y = 0)
const dataPlaneXZ = {
   x: [-10, 10, 10, -10],
   y: [0, 0, 0, 0],
   z: [-10, -10, 10, 10],
   delaunayaxis: 'y',
   type: 'mesh3d',
   colorscale: 'Viridis',
   opacity: 0.5,
   lighting: {
      specular: 0.2,
      ambient: 0.8,
      diffuse: 0.5,
      fresnel: 0.2,
   },
};

// Plane y-z (x = 0)
const dataPlaneYZ = {
   x: [0, 0, 0, 0],
   y: [-10, 10, 10, -10],
   z: [-10, -10, 10, 10],
   delaunayaxis: 'x',
   type: 'mesh3d',
   colorscale: 'Viridis',
   opacity: 0.5,
   lighting: {
      specular: 0.2,
      ambient: 0.8,
      diffuse: 0.5,
      fresnel: 0.2,
   },
};

// Data for the chart, including the lines for the reference planes
const data = [trace, dataPlaneXY, dataPlaneXZ, dataPlaneYZ];

// Configure the layout of the 3D chart
const layout = {
   scene: {
      xaxis: { title: 'X Coordinate', range: [-10, 10], showaxeslines: true },
      yaxis: { title: 'Y Coordinate', range: [-10, 10], showaxeslines: true },
      zaxis: { title: 'Z Coordinate', range: [-10, 10], showaxeslines: true },
      aspectmode: 'cube', //  ensures the axes have the same scale
      showaxeslines: true, // Show axis lines
   },
};
// Draw the 3D chart
Plotly.newPlot('coordinateChart', data, layout);
<div id='coordinateChart' style="height:450px"></div>
<script src="https://cdnjs.cloudflare.com/ajax/libs/plotly.js/2.24.3/plotly.min.js" integrity="sha512-OB3KqMv8ZelkEhNOv1J6PB0aYRkn8oota0+LoGXIVD3hv1Pu9ebxFJXBopRlGkYLTLEUM7aX9zBepBzGcZzH5A==" crossorigin="anonymous" referrerpolicy="no-referrer"></script>关于javascript - 在plotly.js中获取X、Y和Z引用平面,我们在Stack Overflow上找到一个类似的问题: https://stackoverflow.com/questions/76749011/