这是我关于堆栈溢出的第一个问题,我希望有人可以帮助我:)
我想使用 PlateCaree 和 Mercator 投影在 matplotlib 中投影地球表面,并向其添加小圆圈以获得天梭指示线。
我查了很多资料,但在网上找不到正确的答案。到目前为止,我可以画出我的圆圈,但它们保持不变,并且没有像预期的那样拉伸(stretch)。这是我到目前为止所拥有的:
import cartopy.crs as ccrs
import cartopy.feature as cfeature
import matplotlib.pyplot as plt
import matplotlib.patches as mpatches
import math

def main():
    # Setting values
    proj = ccrs.PlateCarree()
    lonW = -90
    lonE = 90
    latS = -90
    latN = 90
    cLat = (latN + latS) / 2
    cLon = (lonW + lonE) / 2
    res = '110m'

    fig = plt.figure(figsize=(11, 8.5))
    ax = plt.subplot(1, 1, 1, projection=proj)
    ax.gridlines( draw_labels=True, linewidth=2, color='gray', alpha=0.5, linestyle='--')
    ax.set_extent([lonW, lonE, latS, latN], crs=proj)
    ax.coastlines(resolution=res, color='black')

    ax.add_feature(cfeature.LAND)
    ax.add_feature(cfeature.OCEAN)
    ax.add_feature(cfeature.BORDERS, linestyle='-', linewidth=0.5)
    ax.add_feature(cfeature.LAKES)

    # Adding a single coordinate
    ax.scatter(24.3, 61.83, color='red', marker='o', s=6, transform=proj, label='Hyytiälä')

    # Adding first circle
    center_lon, center_lat = 0, 0
    r = 10
    ax.add_patch(mpatches.Circle(xy=[center_lon, center_lat], radius=r, color='red', alpha=0.3, transform=proj, zorder=30))

    # Adding a second circle
    center_lon, center_lat = 0, 30
    r = 10
    ax.add_patch(mpatches.Circle(xy=[center_lon, center_lat], radius=r, color='red', alpha=0.3, transform=proj, zorder=30))

    # Adding a third circle
    center_lon, center_lat = 0, 60
    r = 10
    ax.add_patch(mpatches.Circle(xy=[center_lon, center_lat], radius=r, color='red', alpha=0.3, transform=proj, zorder=30))

    # Adding a last circle
    center_lon, center_lat = 0, 90
    r = 10
    ax.add_patch(mpatches.Circle(xy=[center_lon, center_lat], radius=r, color='red', alpha=0.3, transform=proj, zorder=30))
非常感谢:)
最佳答案
Cartopy 已经将此内置函数作为任何轴上的专用方法,因此更简单的方法是:
import matplotlib.pyplot as plt
import matplotlib as mpl
import cartopy.crs as ccrs
config = {
"Plate Carree": dict(projection=ccrs.PlateCarree()),
"Mercator": dict(projection=ccrs.Mercator()),
}
layout = [[name] for name in config.keys()]
fig, axs = plt.subplot_mosaic(
layout, figsize=(6,9), facecolor="w", dpi=100,
layout="compressed", per_subplot_kw=config, height_ratios=[1.2,2],
)
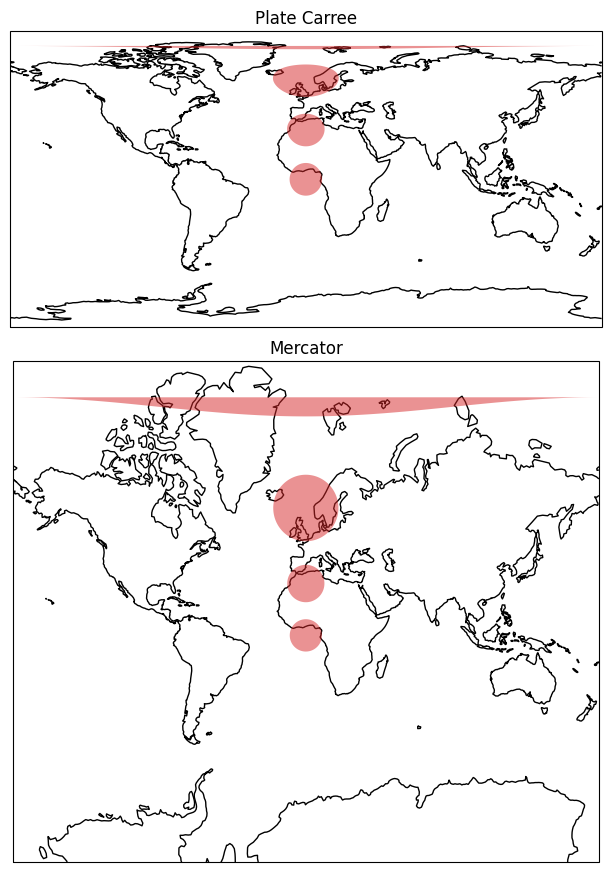
for name, ax in axs.items():
ax.coastlines()
ax.set_title(name)
ax.tissot(alpha=.3, fc="C3")

我不确定这是否是您想要的,您可以通过绘制圆圈来手动完成,如下所示。为此,您可以使用以下代码替换 ax.tissot() ,或多或少地使用您已定义的点:
from shapely.geometry import Polygon
from cartopy.geodesic import Geodesic
    # in the axes loop:
    for lon, lat, r in [
        (0,0,10*110000),
        (0,30,10*110000),
        (0,60,10*110000),
        (0,89,10*110000), # 90° has a height of 0
    ]:

        circle_points = Geodesic().circle(lon=lon, lat=lat, radius=r)
        ax.add_geometries(
            (Polygon(circle_points),), facecolor='C3', alpha=.5,
            crs=ccrs.PlateCarree(),
        )
半径应以米为单位,我使用 10 度的半径粗略地定义为每度 110000 米。
编辑:这是 Cartopy 使用的自动和更多手动方法的示例:
from shapely.geometry import Polygon
from cartopy.geodesic import Geodesic
import matplotlib.pyplot as plt
import matplotlib as mpl
import cartopy.crs as ccrs
import cartopy
from pyproj import geod

fig, ax = plt.subplots(figsize=(4,4), facecolor="w", dpi=100, layout="compressed", subplot_kw=dict(projection=ccrs.PlateCarree()))

radius = 300 # km
n_samples = 80
lons = (0, 0, 0, 0)
lats = (20, 40, 60, 80)

# auto
ax.tissot(rad_km=radius, lons=lons, lats=lats, n_samples=n_samples, fc='none', ec="C3", lw=2)

# manual
for lon, lat in zip(lons,lats):
    circle = Geodesic().circle(lon, lat, radius*1000., n_samples=n_samples)
    feature = cartopy.feature.ShapelyFeature([Polygon(circle)], ccrs.Geodetic(), fc='none', ec="C0", lw=2, linestyle="--")
    ax.add_feature(feature)


ax.coastlines(alpha=.5, lw=0.4)
ax.set_extent((-45,45,0,90), crs=ccrs.PlateCarree())

关于python - 如何使用 Matplotlib 在不同的投影中绘制 Tissot 指标线?,我们在Stack Overflow上找到一个类似的问题: https://stackoverflow.com/questions/76826132/