我有下图,我希望对其进行格式化,以便每个轴上的刻度线是由粗黑色边框界定的区域的上部和下部范围。
ggplot(WPND, aes(x = Year)) +
geom_line(aes(y=FOX_LS), colour="black", size=1.2, linetype=1) +
geom_line(aes(y=FOX_HS), colour="red", size=1.2, linetype=1) +
theme_light() +
theme(axis.text.x = element_text(color= "black", size=11, angle=90, hjust =
-2, vjust = 0.5)) +
theme(axis.text.y = element_text(color = "black", size = 11)) +
ylab(expression("BAI (cm "*{}^2*")")) +
scale_x_continuous(breaks = seq(1960, 2015, by=5)) +
scale_y_continuous(limits = c(0,60), breaks = seq(0, 60, b=10)) +
theme(panel.border = element_rect(color = "black", fill = NA, size = 1.5),
panel.grid.minor = element_blank(),
panel.grid.major = element_line(color = 'grey', linetype= 'dashed'),
axis.ticks.length = unit(-0.25, "cm"),
axis.ticks = element_line(color = "black", size = 1),
axis.text.x = element_text(margin = unit(c(0.5,0.5,0.5,0.5), "cm")),
axis.text.y = element_text(margin = unit(c(0.5,0.5,0.5,0.5), "cm")))`
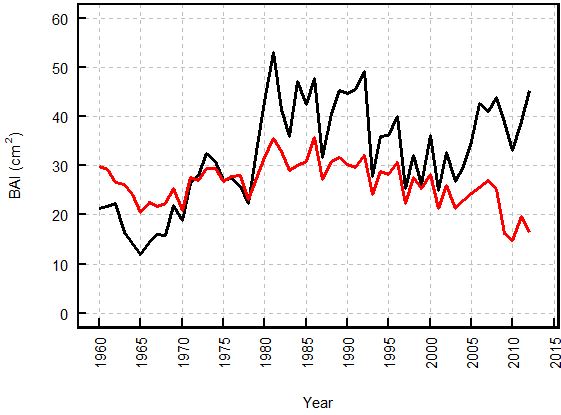
我在 ggplot 中制作的图
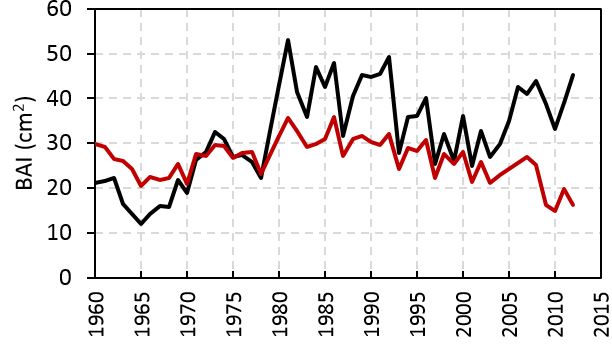
我想要刻度线/边距的外观(Excel 中制作的图)
最佳答案
您必须将 expand = c(0,0) 参数添加到 x 和 y 尺度:
... +
scale_x_continuous(breaks = seq(1960, 2015, by=5), expand = c(0,0)) +
scale_y_continuous(limits = c(0,60), breaks = seq(0, 60, b=10), expand = c(0,0)) +
...
关于r - 如何将轴刻度线的限制调整为与 ggplot 中的边框相同?,我们在Stack Overflow上找到一个类似的问题: https://stackoverflow.com/questions/44284877/