我正在尝试使用霍夫变换,不幸的是它似乎没有输出与绘制的线相对应的 r 和 theta。我一直试图在这个网站和其他网站上找到答案,但到目前为止我尝试的一切都失败了。
I=zeros(80, 80);
for n=1:25;
  I(n+20, n+2)=1;
  I(n+1, n*2+17)=1;
  I(n+1, n*2+16)=1;
  end

hough = houghtf(I,"line", pi*[0:360]/180);
threshHough = hough>.9*max(hough(:));
[r, theta] = find(threshHough>0)
%theta = (theta-91)*pi/180
%r=r-size(hough,1)/2

imshow(I)
最佳答案
Octave 中的 thoughtf 函数将一行参数化为
r = x*cos(theta) + y*sin(theta)
输出是一个 NxM 矩阵,其中第一个维度代表 r,第二个维度代表 theta。
documentation对r参数不是很清楚。它只说明了 N = 2*diag_length - 1,其中 diag_length 是图像的对角线长度。但它甚至没有告诉你起源在哪里。经过一番实验,我发现原点位于(N-1)/2。因此,在索引 (ii,jj) 处找到峰值后,
r = ii - (size(hough,1)-1)/2;
文档中对 theta 参数进行了更好的描述:返回的 bin 对应于输入中给出的值。因此,theta 是传递给 houghft 的数组 pi*[0:360]/180 的索引。你可以写:
angles = pi*[0:360]/180;
theta = angles(jj);
请注意,霍夫变换处理的是线的方向,而不是线的方向。您可以使用 theta 或 theta+180 对同一行进行参数化。因此,上面代码生成的 hough 图像是多余的,所有方向都重复两次(实际上,0 度方向的结果在 180 度和 360 度处重复两次)。相反,使用
angles = pi*[0:179]/180;
接下来,简单地对霍夫变换进行阈值处理并获取所有像素并不是最好的方法:一些峰值会更强,导致领结形状的检测,您将只想使用其中的最高点。 bwmorph 函数的 'shrink' 方法是一种快速而简单的方法,可将阈值后的检测减少到单个点,但不能保证有效最高点。另请注意,对于 0 度的线条,领结在图像边缘被切成两半,另一半以 179 度的角度出现。这需要额外的努力来修复。下面,我通过稍微扩展角度来修复它,然后删除重复的点。
最后,在参数化该行时,Octave 似乎选择 x 作为图像中的第一个索引,将 y 作为第二个索引,这与imshow 确实如此。
把它们放在一起,我们得到:
% Create test image with some lines
I = zeros(80, 80);
for n=1:25;
  I(n+20,n+2) = 1;
  I(n+1,n*2+17) = 1;
  I(n+1,n*2+16) = 1;
end
I(34:73,55) = 1;
I(60,15:64) = 1;

% Compute the Hough transform
angles = pi*[-10:189]/180;
hough = houghtf(I,"line",angles);

% Detect maxima in the Hough transform -- this is a bit of a hack
detect = hough>.5*max(hough(:));
detect = bwmorph(detect,'shrink',inf);
[ii, jj] = find(detect);
r = ii - (size(hough,1)-1)/2;
theta = angles(jj);

% Remove duplicate points by deleting any point with an angle
% outside of the interval [0,180).
dup = theta<-1e-6 | theta>=pi-1e-6;
r(dup) = [];
theta(dup) = [];

% Compute line parameters (using Octave's implicit singleton expansion)
r = r(:)';
theta = theta(:)';
x = repmat([1;80],1,length(r)); % 2xN matrix, N==length(r)
y = (r - x.*cos(theta))./sin(theta); % solve line equation for y
% The above goes wrong when theta==0, fix that:
horizontal = theta < 1e-6;
x(:,horizontal) = r(horizontal);
y(:,horizontal) = [1;80];

% Plot
figure
imshow(I)
hold on
plot(y,x,'r-','linewidth',2) % note the reversed x and y!
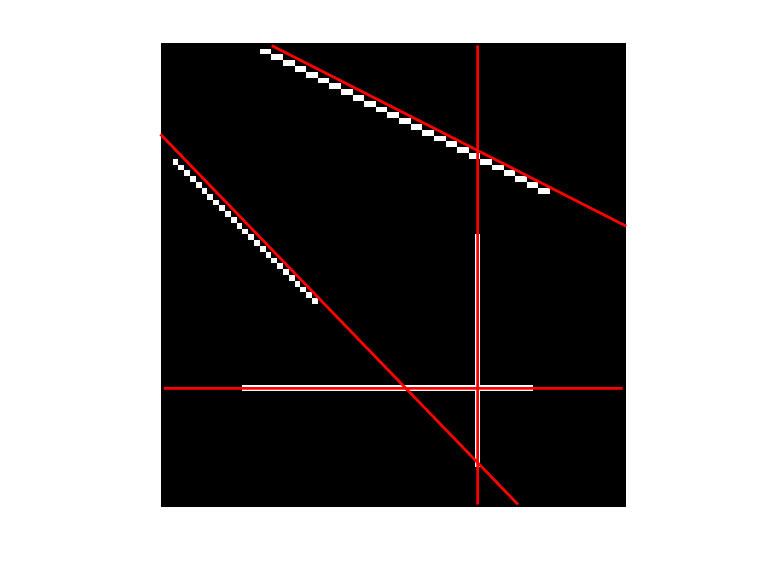
由于我们检测它们的方式,对角线偏离了一个像素。我们从来没有寻找局部最大值的位置,我们取了高于阈值的所有像素并选择了中间的点。
关于octave - GNU Octave : Hough Transform,我们在Stack Overflow上找到一个类似的问题: https://stackoverflow.com/questions/48198179/