我有多个数据框,其中第一列(最后填充了 NA)是波数,其他列是多次观测的特定波数的变量。
是否有可能以这样的方式绘制列:我的第一列包含 x 轴变量,而另一列则用各自的 y 值绘制成一个大图?
我已经尝试过“matplot”(结果是“数字”而不是点),
matplot(df[,1],df[,3:5],xlab = "Wavelength [nm]", ylab = "Absorbance")
不同的“xyplot”集(不可能给出多个 y 值),但似乎都不起作用(就我对 R 的了解水平而言)。
最终结果应如下所示:
感谢您的帮助!
最佳答案
你总是可以创建自己的函数来执行此操作;当没有什么真正适合我的需要时,我会定期创建这样的函数。 我很快就把它组合在一起,但你可以根据你的需要进行调整。
# generate data
set.seed(6)
n <- 50
dat <- data.frame(x1=seq(1,100, length.out = n),
                  x2=seq(1,20, length.out = n)+rnorm(n),
                  x3=seq(1,20, length.out = n)+rnorm(n, mean = 3),
                  x4=seq(1,20, length.out = n)+rnorm(n, mean = 5))
# make some NAs at the end
dat[45:n,2] <- NA
dat[30:n,3] <- NA


plot_multi <- function(df, x=1, y=2, cols=y,
                       xlim=range(df[,x], na.rm = T),
                       ylim=range(df[,y], na.rm = T),
                       main="", xlab="", ylab="", ...){
  # setup plot frame
  plot(NULL,
       xlim=xlim,
       ylim=ylim,
       main=main, xlab=xlab, ylab=ylab)

  # plot all your y's against your x
  pb <- sapply(seq_along(y), function(i){
    points(df[,c(x, y[i])], col=cols[i], ...)
  })
}

plot_multi(dat, y=2:4, type='l', lwd=3, main = ":)",
           xlab = "Wavelength", ylab = "Absorbance")
结果:

编辑
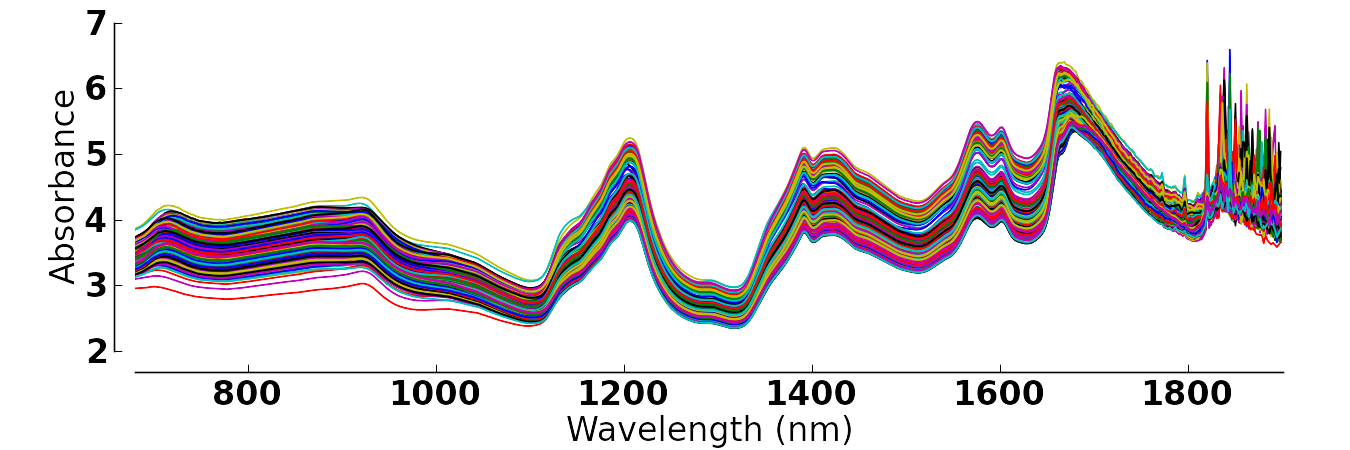
实际上,我偶然在网上找到了您的数据集,因此我将介绍如何使用上面的代码绘制它。
file <- 'http://openmv.net/file/tablet-spectra.csv'
spectra <- read.csv(file, header = FALSE)

# remove box label
spectra <- spectra[,-1]

# add the 'wavelength' and rotate the df
# (i didn't find the actual wavelength values, but hey).
spectra <- cbind(1:ncol(spectra), t(spectra))

plot_multi(spectra, y=2:ncol(spectra), cols = rainbow(ncol(spectra)),
           type='l', main=":))", ylab="Absorbance", xlab = "'Wavelength'")

关于r - 使用 R 在一张图中绘制光谱数据,我们在Stack Overflow上找到一个类似的问题: https://stackoverflow.com/questions/55610644/