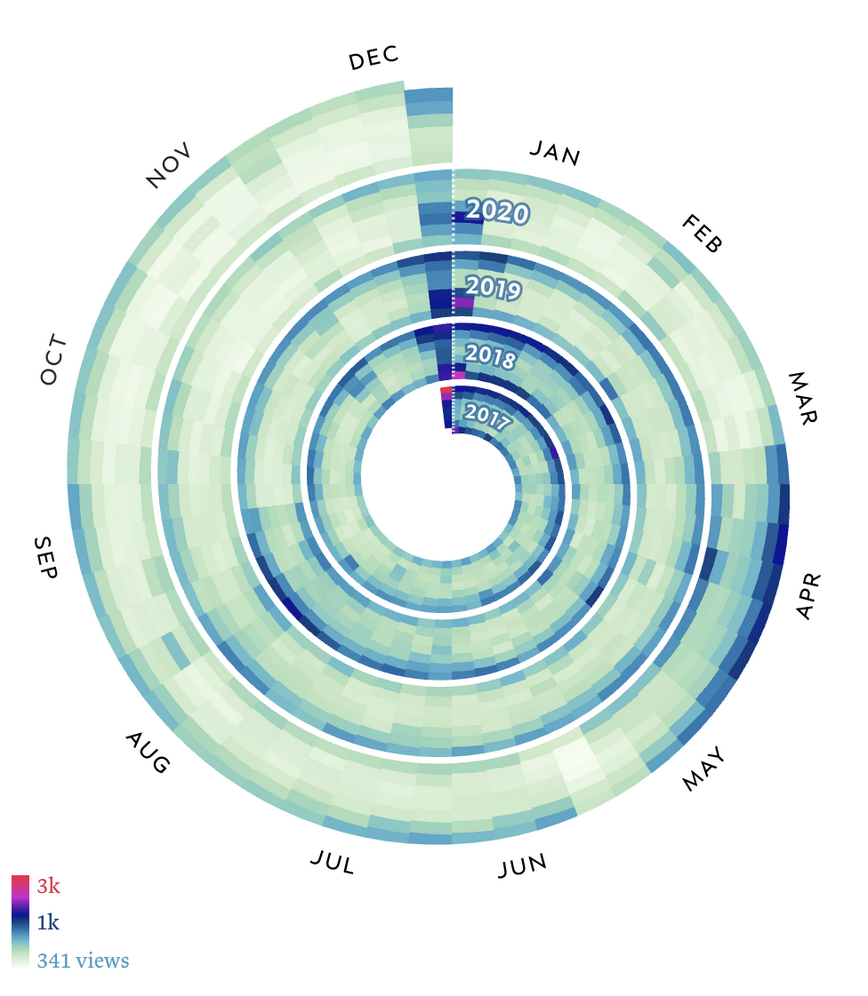
我正在尝试用螺旋形的每日数据包装热图。继此example我想将日期放在一起,并在星期变化时向右移动。如果使用上面的例子,我会得到彼此相邻的日子。
我尝试改编示例中的代码,尽管我取得了很好的进展,但如有任何帮助,我们将不胜感激。这些段没有很好地对齐,并且有些路径不应该在那里。当然,我在调整计算时犯了一些错误。
想要的结果
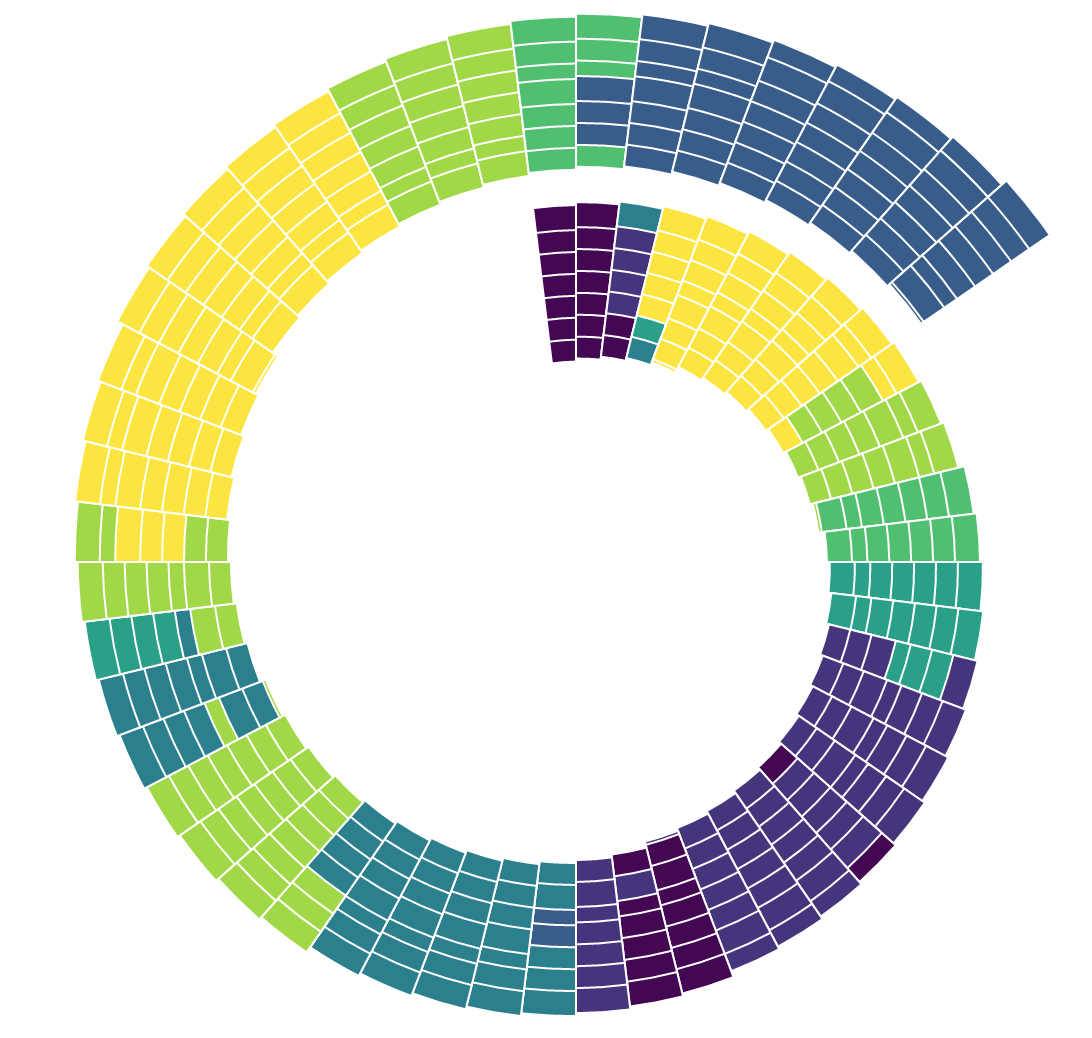
目前进展
代码
const radians = 0.0174532925;

//CHART CONSTANTS
const chartRadius = 100;
const chartWidth = chartRadius * 3;
const chartHeight = chartRadius * 3;
const labelRadius = chartRadius + 5;
const margin = { "top": 180, "bottom": 40, "left": 180, "right": 40 };
const months = ["Jan", "Feb", "Mar", "Apr", "May", "Jun", "Jul", "Aug", "Sep", "Oct", "Nov", "Dec"];

//CHART OPTIONS
const holeRadiusProportion = 0.75; //fraction of chartRadius. 0 gives you some pointy arcs in the centre.
const holeRadius = holeRadiusProportion * chartRadius;
const segmentsPerCoil = 52; //number of coils. for this example, I have 12 months per year. But you change to whatever suits your data.
const segmentAngle = 360 / segmentsPerCoil;
let coils; //number of coils, based on data.length / segmentsPerCoil
let coilWidth; //remaining chartRadius (after holeRadius removed), divided by coils + 1. I add 1 as the end of the coil moves out by 1 each time

//SCALES
const colour = d3.scaleSequential(d3.interpolateViridis);

//CREATE SVG AND A G PLACED IN THE CENTRE OF THE SVG
const svg = d3.select("#chart")
    .append("svg")
    .attr("width", chartWidth + margin.left + margin.right)
    .attr("height", chartHeight + margin.top + margin.bottom);

const g = svg.append("g")
    .attr("transform", "translate("
    + (margin.left + chartRadius)
    + ","
    + (margin.top + chartRadius) + ")");

// count the weeks
let week = 0

//LOAD THE DATA
d3.csv("restrictions_daily.csv", convertTextToNumbers, function (error, data) {
    if (error) { throw error; };

    // get the week number
    data.forEach(function (d) {
      const dateParse = d3.timeParse("%d/%m/%Y")(d.date)
      d.week = week
      if (+d3.timeFormat("%d")(dateParse) % 7 === 0)
      week = week + 1
    })

    //CALCULATE AND STORE THE REMAING
    let dataLength = 52
    coils = Math.ceil(dataLength / segmentsPerCoil);
    coilWidth = (chartRadius * (1 - holeRadiusProportion)) / (coils + 1);
    //console.log("coilWidth: " + coilWidth);
    var dataExtent = d3.extent(data, function (d) { return d.value; });
    colour.domain(dataExtent);

    //ADD LABELS AND GRIDS FOR EACH MONTH FIRST
    //SO THE GRID LINES APPEAR BEHIND THE SPIRAL
    var monthLabels = g.selectAll(".month-label")
        .data(months)
        .enter()
        .append("g")
        .attr("class", "month-label");

    monthLabels.append("text")
        // .text(function (d) { return d; })
        .attr("x", function (d, i) {
            let labelAngle = (i * segmentAngle) + (segmentAngle / 2);
            return x(labelAngle, labelRadius);
        })
        .attr("y", function (d, i) {
            let labelAngle = (i * segmentAngle) + (segmentAngle / 2);
            return y(labelAngle, labelRadius);
        })
        .style("text-anchor", function (d, i) {
            return i < (months.length / 2) ? "start" : "end";
        });

    monthLabels.append("line")
        .attr("x2", function (d, i) {
            let lineAngle = (i * segmentAngle);
            let lineRadius = chartRadius + 10;
            // return x(lineAngle, lineRadius);
        })
        .attr("y2", function (d, i) {
            let lineAngle = (i * segmentAngle);
            let lineRadius = chartRadius + 10;
            // return y(lineAngle, lineRadius);
        });

    // reset the days when new week starts
    let firstDay = 0
    //ASSUMING DATA IS SORTED, CALCULATE EACH DATA POINT'S SEGMENT VERTICES
    data.forEach(function (d, i) {

        let coil = Math.floor(i / segmentsPerCoil);
        let position = +d.week - 1;

        console.log(d)

        //  divide radius by 7 to get proportion for each day
        const dayHeight = holeRadius / 7

        // reset day of the week
        if (i % 7 === 0) {
          firstDay = 0
        }

        const newRadius = (dayHeight * firstDay) + 100

        // increment the day
        firstDay = firstDay + 1


        //console.log("positions: " + i + " " + coil + " " + position);

        let startAngle = position * segmentAngle;
        let endAngle = (position + 1) * segmentAngle;

        //console.log("angles: " + startAngle + " " + endAngle);
        //console.log(holeRadius + " " + segmentsPerCoil + " " + coilWidth)

        let startInnerRadius = newRadius + ((i / segmentsPerCoil) * coilWidth)
        let startOuterRadius = newRadius + ((i / segmentsPerCoil) * coilWidth) + coilWidth;
        let endInnerRadius = newRadius + (((i + 1) / segmentsPerCoil) * coilWidth)
        let endOuterRadius = newRadius + (((i + 1) / segmentsPerCoil) * coilWidth) + coilWidth;

        console.log(startInnerRadius, startOuterRadius, endInnerRadius, endInnerRadius, startAngle, endAngle)

        //console.log("start radi: " + startInnerRadius + " " + startOuterRadius);
        //console.log("end radi: " + endInnerRadius + " " + endOuterRadius);

        //vertices of each segment
        d.x1 = x(startAngle, startInnerRadius);
        d.y1 = y(startAngle, startInnerRadius);

        d.x2 = x(endAngle, endInnerRadius);
        d.y2 = y(endAngle, endInnerRadius);

        d.x3 = x(endAngle, endOuterRadius);
        d.y3 = y(endAngle, endOuterRadius);

        d.x4 = x(startAngle, startOuterRadius);
        d.y4 = y(startAngle, startOuterRadius);

        //CURVE CONTROL POINTS
        let midAngle = startAngle + (segmentAngle / 2)
        let midInnerRadius = newRadius + (((i + 0.5) / segmentsPerCoil) * coilWidth)
        let midOuterRadius = newRadius + (((i + 0.5) / segmentsPerCoil) * coilWidth) + coilWidth;

        //MID POINTS, WHERE THE CURVE WILL PASS THRU
        d.mid1x = x(midAngle, midInnerRadius);
        d.mid1y = y(midAngle, midInnerRadius);

        d.mid2x = x(midAngle, midOuterRadius);
        d.mid2y = y(midAngle, midOuterRadius);

        //FROM https://stackoverflow.com/questions/5634460/quadratic-b%C3%A9zier-curve-calculate-points
        d.controlPoint1x = (d.mid1x - (0.25 * d.x1) - (0.25 * d.x2)) / 0.5;
        d.controlPoint1y = (d.mid1y - (0.25 * d.y1) - (0.25 * d.y2)) / 0.5;

        d.controlPoint2x = (d.mid2x - (0.25 * d.x3) - (0.25 * d.x4)) / 0.5;
        d.controlPoint2y = (d.mid2y - (0.25 * d.y3) - (0.25 * d.y4)) / 0.5;

        //console.log(d);

    });

    var arcs = g.selectAll(".arc")
        .data(data)
        .enter()
        .append("g")
        .attr("class", "arc");

    //STRAIGHT EDGES
    /*
    arcs.append("path")
        .attr("d", function (d) {
            let M = "M " + d.x1 + " " + d.y1;
            let L1 = "L " + d.x2 + " " + d.y2;
            let L2 = "L " + d.x3 + " " + d.y3;
            let L3 = "L " + d.x4 + " " + d.y4;
            return M + " " + L1 + " " + L2 + " " + L3 + " Z"
        })
        //.style("fill", function (d) { return colour(d.value); })
        .style("fill", "white")
        .style("stroke", "white")
    */

    //CURVED EDGES
    arcs.append("path")
        .attr("d", function (d) {
            //start at vertice 1
            let start = "M " + d.x1 + " " + d.y1;
            //inner curve to vertice 2
            let side1 = " Q " + d.controlPoint1x + " " + d.controlPoint1y + " " + d.x2 + " " + d.y2;
            //straight line to vertice 3
            let side2 = "L " + d.x3 + " " + d.y3;
            //outer curve vertice 4
            let side3 = " Q " + d.controlPoint2x + " " + d.controlPoint2y + " " + d.x4 + " " + d.y4;
            //combine into string, with closure (Z) to vertice 1
            return start + " " + side1 + " " + side2 + " " + side3 + " Z"
        })
        .style("fill", function (d) { return colour(d.value); })
        .style("stroke", "white")

    //ADD LABELS FOR THE YEAR AT THE START OF EACH COIL (IE THE FIRST MONTH)
    var yearLabels = arcs.filter(function (d) { return d.month == 1; }).raise();

    yearLabels.append("path")
        .attr("id", function (d) { return "path-" + d.year; })
        .attr("d", function (d) {
            //start at vertice 1
            let start = "M " + d.x1 + " " + d.y1;
            //inner curve to vertice 2
            let side1 = " Q " + d.controlPoint1x + " " + d.controlPoint1y + " " + d.x2 + " " + d.y2;
            return start + side1;
        })
        .style("fill", "none")
    //.style("opacity", 0);

    yearLabels.append("text")
        .attr("class", "year-label")
        .attr("x", 3)
        .attr("dy", -5)
        .append("textPath")
        .attr("xlink:href", function (d) {
            return "#path-" + d.year;
        })
        .text(function (d) { return d.year; })

    // //DRAW LEGEND
    //
    // const legendWidth = chartRadius;
    // const legendHeight = 20;
    // const legendPadding = 40;
    //
    // var legendSVG = d3.select("#legend")
    //     .append("svg")
    //     .attr("width", legendWidth + legendPadding + legendPadding)
    //     .attr("height", legendHeight + legendPadding + legendPadding);
    //
    // var defs = legendSVG.append("defs");
    //
    // var legendGradient = defs.append("linearGradient")
    //     .attr("id", "linear-gradient")
    //     .attr("x1", "0%")
    //     .attr("y1", "0%")
    //     .attr("x2", "100%")
    //     .attr("y2", "0%");
    //
    // let noOfSamples = 20;
    // let dataRange = dataExtent[1] - dataExtent[0];
    // let stepSize = dataRange / noOfSamples;
    //
    // for (i = 0; i < noOfSamples; i++) {
    //     legendGradient.append("stop")
    //         .attr("offset", (i / (noOfSamples - 1)))
    //         .attr("stop-color", colour(dataExtent[0] + (i * stepSize)));
    // }
    //
    // var legendG = legendSVG.append("g")
    //     .attr("class", "legendLinear")
    //     .attr("transform", "translate(" + legendPadding + "," + legendPadding + ")");
    //
    // legendG.append("rect")
    //     .attr("x", 0)
    //     .attr("y", 0)
    //     .attr("width", legendWidth)
    //     .attr("height", legendHeight)
    //     .style("fill", "url(#linear-gradient)");
    //
    // legendG.append("text")
    //     .text("Fewer nights")
    //     .attr("x", 0)
    //     .attr("y", legendHeight - 35)
    //     .style("font-size", "12px");
    //
    // legendG.append("text")
    //     .text("More nights")
    //     .attr("x", legendWidth)
    //     .attr("y", legendHeight - 35)
    //     .style("text-anchor", "end")
    //     .style("font-size", "12px");
    //
});

function x(angle, radius) {
    //change to clockwise
    let a = 360 - angle;
    //start from 12 o'clock
    a = a + 180;
    return radius * Math.sin(a * radians);
};

function y(angle, radius) {
    //change to clockwise
    let a = 360 - angle;
    //start from 12 o'clock
    a = a + 180;
    return radius * Math.cos(a * radians);
};

function convertTextToNumbers(d) {
    d.year = +d.year;
    d.month = +d.month;
    d.value = +d.value;
    return d;
};
感谢您的帮助和建议!
最佳答案
以下是 spiralArc 的示例(类似于 D3 的具有变化半径的 arc):
const spiralArc = (fromRadius, toRadius, width, fromAngle, toAngle) => {
  const x1 = fromRadius * Math.sin(fromAngle);
  const y1 = fromRadius * -Math.cos(fromAngle);
  const x2 = (fromRadius + width) * Math.sin(fromAngle);
  const y2 = (fromRadius + width) * -Math.cos(fromAngle);
  const x3 = toRadius * Math.sin(toAngle);
  const y3 = toRadius * -Math.cos(toAngle);
  const x4 = (toRadius + width) * Math.sin(toAngle);
  const y4 = (toRadius + width) * -Math.cos(toAngle);
  return `
    M ${x1},${y1}
    L ${x2},${y2}
    A ${fromRadius},${fromRadius} 1 0 1 ${x4},${y4}
    L ${x3},${y3}
    A ${fromRadius},${fromRadius} 0 0 0 ${x1},${y1}`;
}

const svg = d3.select('svg');
const g = svg.append('g')
    .attr('transform', 'translate(300,300)')

const WIDTH = 10;
const BASE_RADIUS = 30;
const angle = Math.PI * 2 / 30;
for (let index = 0; index < 100; index++) {
  const fromAngle = angle * index;
  const toAngle = angle * (index + 1);
  for (let level = 0; level < 5; level++) {
    const fromRadius = BASE_RADIUS + index * 2 + WIDTH * level;
    const toRadius = BASE_RADIUS + (index + 1) * 2 + WIDTH * level;
    const path = spiralArc (fromRadius, toRadius, WIDTH, fromAngle, toAngle);
    const color = `rgb(0,${192 + Math.random() * 64},255)`
    g.append('path').attr('d', path).style('fill', color)
  }
}
<script src="https://cdnjs.cloudflare.com/ajax/libs/d3/7.0.0/d3.min.js"></script>
<svg width="600" height="600" />关于javascript - 如何将热图包裹在螺旋(季节性螺旋)- d3 上?,我们在Stack Overflow上找到一个类似的问题: https://stackoverflow.com/questions/68140699/