在 R 中绘制圆形直方图的最佳方法是什么?
我的数据具有以下形式:
    Dir      N
 1: 360  56564
 2:   0     NA
 3: 180 149374
 4: 210  82219
 5: 240  23315
 6: 300  11436
 7: 330  30648
 8:  30  32198
 9:  60  15266
10:  90  14596
11: 120  26267
12: 150  81782
13: 270  10100
我尝试使用循环包中的windrose函数,但它需要其他格式的输入数据。
我研究了图形::函数和星号看起来很有希望,但到目前为止还没有具体的内容。
谢谢
最佳答案
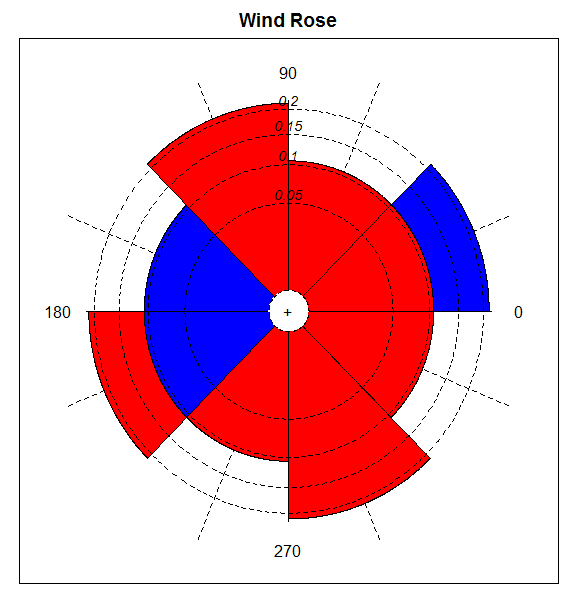
您可以使用circular尝试以下操作,但由于您的数据量很小,因此绘图不是很花哨:
library(circular)
df <- read.table(text='Dir      N
 1: 360  56564
 2:   0     NA
 3: 180 149374
 4: 210  82219
 5: 240  23315
 6: 300  11436
 7: 330  30648
 8:  30  32198
 9:  60  15266
10:  90  14596
11: 120  26267
12: 150  81782
13: 270  10100', header=TRUE)
rownames(df) <- NULL
names(df) <- c('dir', 'mag')
df$dir <- circular(as.numeric(df$dir), units='degrees')
df$mag <- df$mag / 10000 # scale magnitude
windrose(df, breaks=circular(seq(0, 2 * pi, by = pi/4)), increment=5)
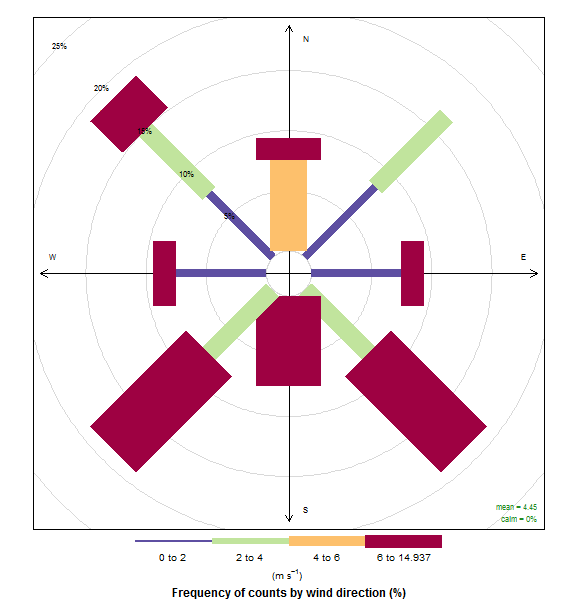
使用另一个库openair,它看起来如下:
library(openair)
df <- read.table(text='Dir      N
     1: 360  56564
     2:   0     NA
     3: 180 149374
     4: 210  82219
     5: 240  23315
     6: 300  11436
     7: 330  30648
     8:  30  32198
     9:  60  15266
    10:  90  14596
    11: 120  26267
    12: 150  81782
    13: 270  10100', header=TRUE)
names(df) <- c('wd', 'ws')
df$ws <- df$ws / 10000 # scale speed
windRose(df, angle=45)
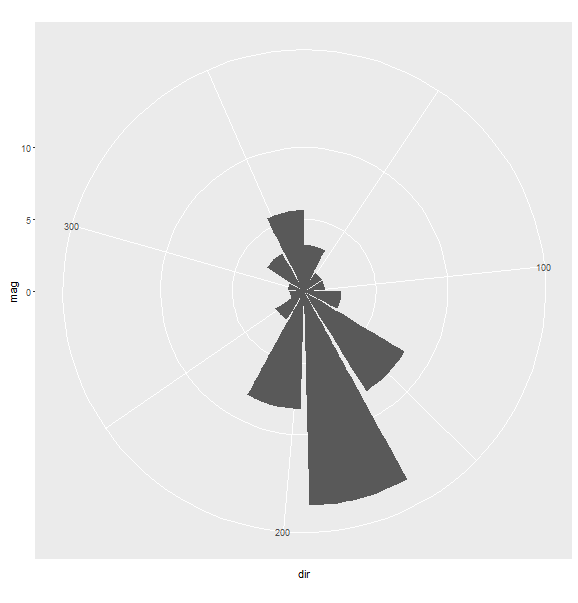
使用ggplot2绘制的极坐标图看起来不同(它只是将geom_bar转换为极坐标)
library(ggplot2)
ggplot(df, aes(x=dir, y=mag)) + geom_bar(stat='identity') + coord_polar()
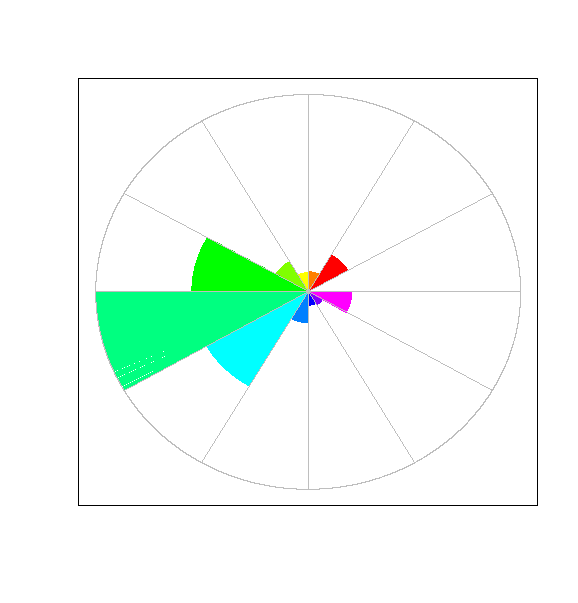
我从头开始在base R中尝试了一些实现(只是出于想法,实现效率不是很高,你总是可以提高实现效率,例如使用polygon 而不是 segments 来填充弧),我们可以在 base R 中使用类似的实现来模仿 ggplot 中的实现:
add.filled.arc <- function(center.x, center.y, radius, angle.start, angle.end, col='black') {
  theta <- seq(angle.start, angle.end, .0001)
  segments(0, 0, radius*cos(theta), radius*sin(theta), col)
  segments(0, 0, cos(angle.start), sin(angle.start), col='gray')
  segments(0, 0, cos(angle.end), sin(angle.end), col='gray')
}

plot.coord.polar <- function(df) {
  df <- df[complete.cases(df),]
  df <- df[order(df[,1]),]
  df[,1] <- df[,1]*(pi/180) # convert dir to radian
  df[,2] <- df[,2] / max(df[,2]) # normalize magnitude within [0-1]
  plot(-1:1, -1:1, type= 'n', xlab='', ylab='', xaxt='n', yaxt='n')
  sapply(1:(nrow(df)-1), function(i) add.filled.arc(0, 0, df[i,2], df[i,1], df[i+1,1], rainbow(nrow(df))[i]))
  theta <- seq(0, 2*pi, 0.0001)
  lines(cos(theta), sin(theta), col='gray')
}

df <- read.table(text='Dir      N
                 1: 360  56564
                 2:   0     NA
                 3: 180 149374
                 4: 210  82219
                 5: 240  23315
                 6: 300  11436
                 7: 330  30648
                 8:  30  32198
                 9:  60  15266
                 10:  90  14596
                 11: 120  26267
                 12: 150  81782
                 13: 270  10100', header=TRUE)
plot.coord.polar(df)
关于R基础图形圆形直方图,我们在Stack Overflow上找到一个类似的问题: https://stackoverflow.com/questions/41627124/