我对 ggplot2 还很陌生,我希望生成一个包含多个散点图及其各自回归估计的图形。但是,我使用的是非标准回归方法(例如分位数回归和总回归),这些方法不在 geom_smooth() 中可用的 method 参数列表中。我有一个适合模型和相应数据的列表。下面是一个工作示例。
require(data.table); require(ggplot2)
N <- 1000 # Generate some data
DT <- NULL
models <- list() # list of of fitted models. For simplicity i am using lm in this example
for(i in 1:8){
x <- rnorm(N)
y <- i*x + rnorm(N)
z <- rep(i,N)
DT <- rbind(DT,data.table(cbind(x=x,y=y,z=z)))
models[[i]] <- lm(y~x,DT)
}
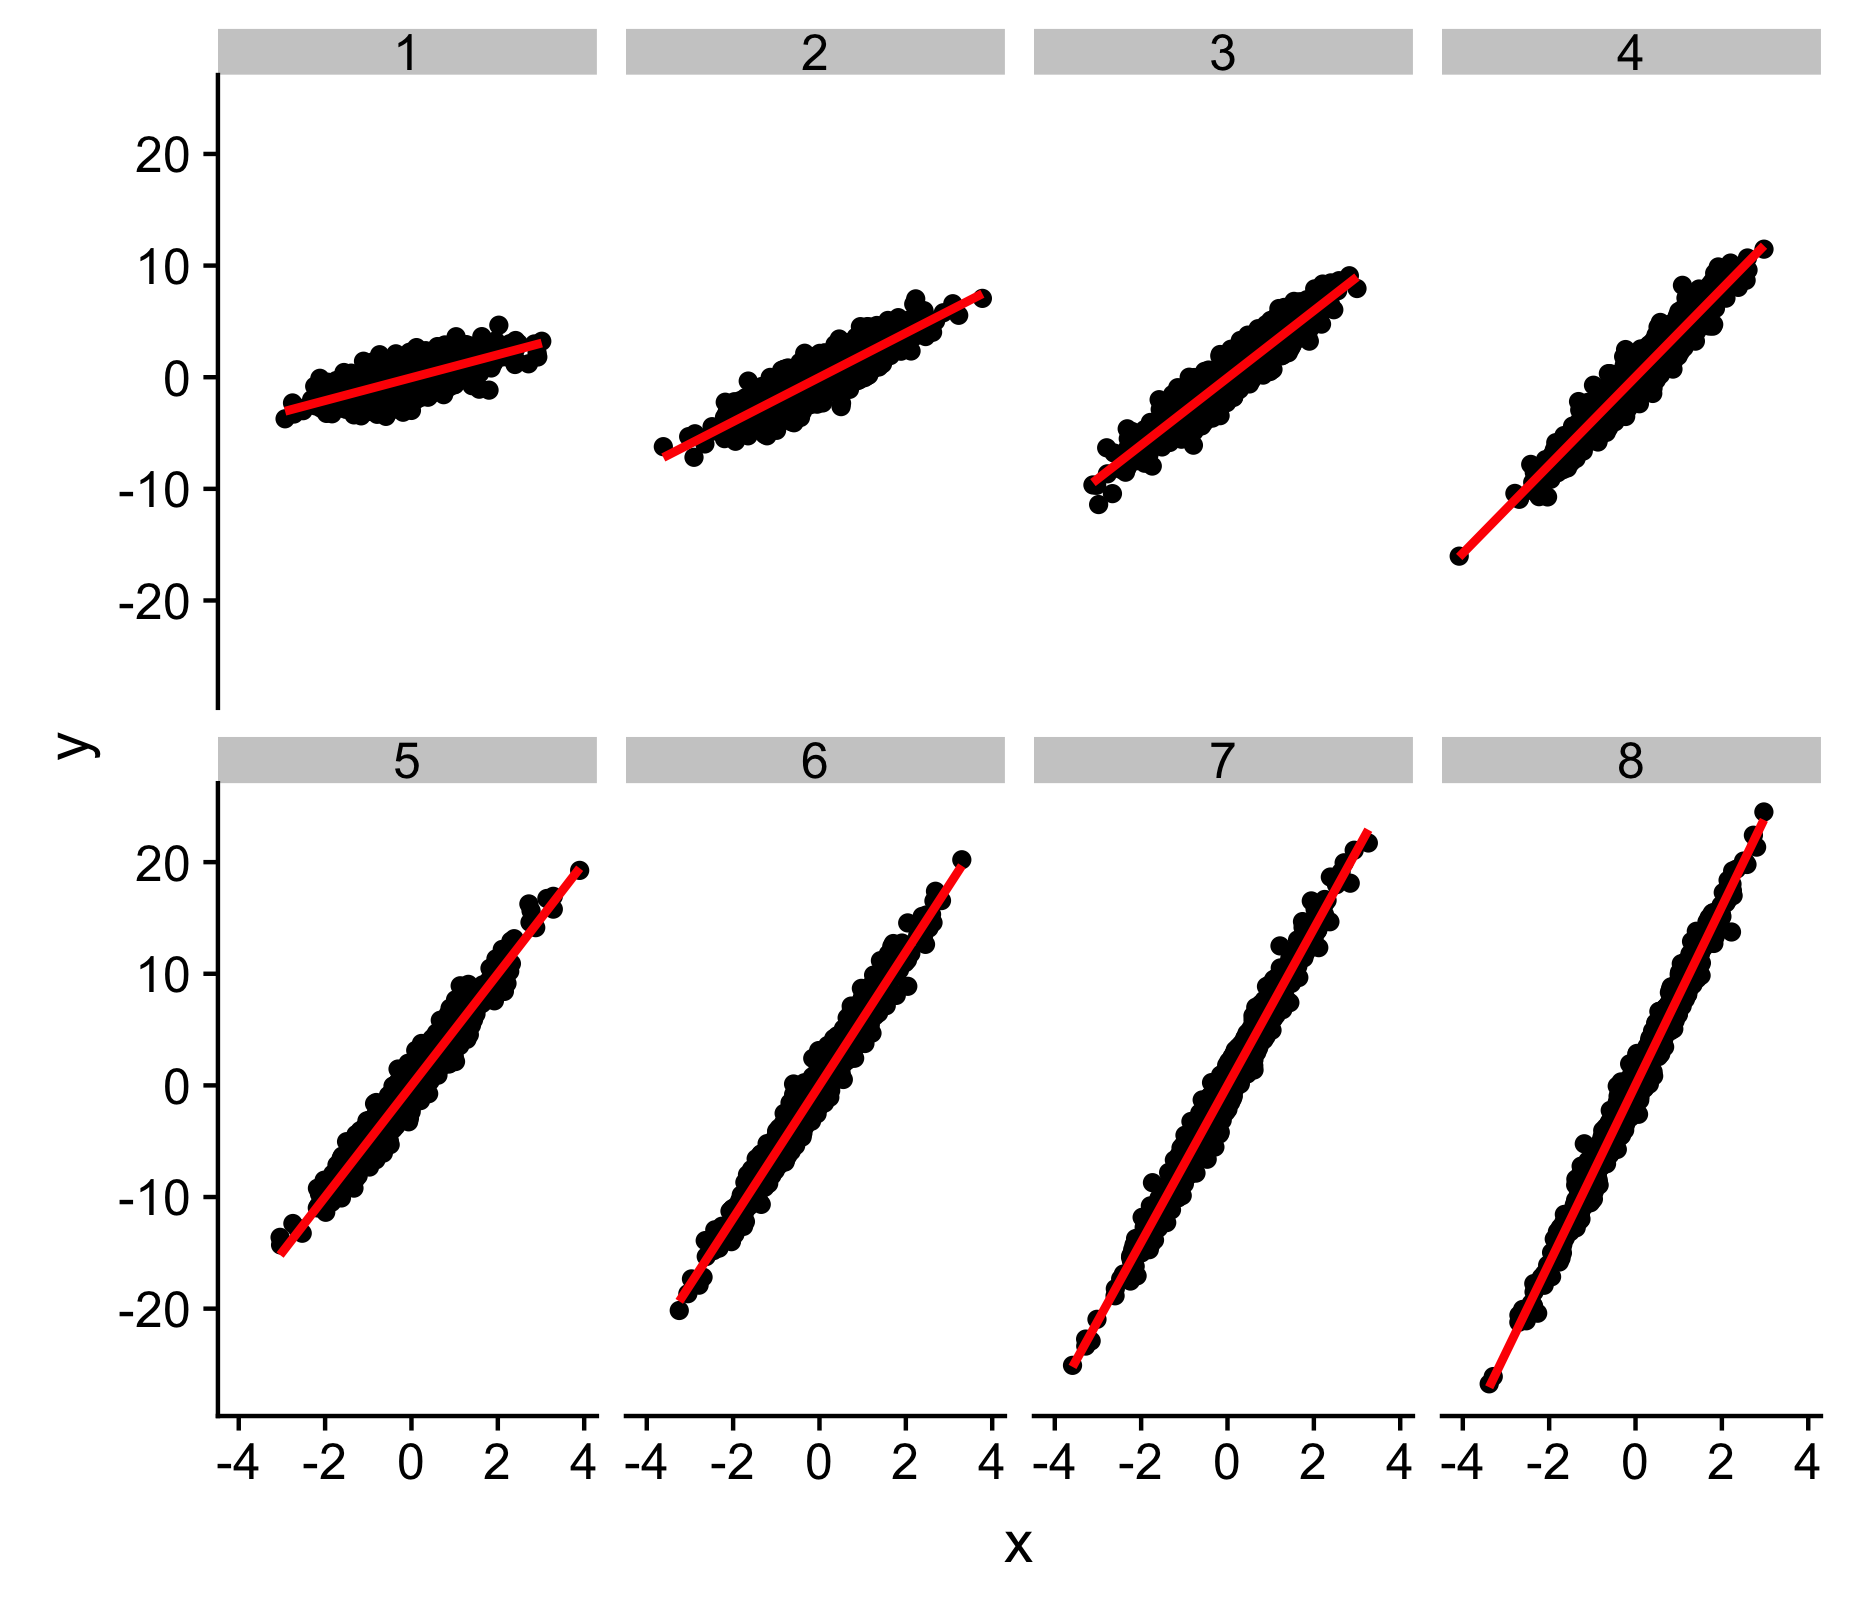
# Traditional way to plot the data with regression estimates is to use geom_smooth
my.plot <- ggplot(DT, aes(x=x, y=y)) + geom_point() +
facet_wrap(~ z, nrow=2, ncol=4) +
geom_smooth(method = "lm", se=FALSE, color="red", formula = y ~ x)
my.plot
我需要一种方法来绘制红色回归估计,而不需要在geom_smooth中拟合回归模型。是否有解决办法可以使我单独的安装模型列表与facet_wrap兼容?
最佳答案
由于不清楚如何将美学映射到模型中使用的变量,因此您需要自己计算线条的值,然后将它们添加为标准 geom_line 图层而不是使用geom_smooth。例如
lines <- purrr::map_dfr(models, function(m) {
  xrng <- range(m$model$x)
  data.frame(x=xrng, y=predict(m, data.frame(x=xrng)))
}, .id="z")

ggplot(DT, aes(x=x, y=y)) + geom_point() +
  facet_wrap(~ z, nrow=2, ncol=4) +
  geom_line(color="red", data=lines)

请注意,此处的斜率看起来有点“偏离”,但这与您实际建模的情况相符(您每次都使用整个 DT)。如果您想在每次迭代中单独估计斜率,则循环应该看起来更像
for(i in 1:8){
  x <- rnorm(N)
  y <- i*x + rnorm(N)
  z <- rep(i,N)
  chunk <- data.table(x=x,y=y,z=z)
  models[[i]] <- lm(y~x,chunk)
  DT <- rbind(DT, chunk)
}
关于r - 使用 ggplot2 和facet_wrap 绘制估计值,无需重新拟合模型,我们在Stack Overflow上找到一个类似的问题: https://stackoverflow.com/questions/54563723/