我能够使用循环计算一维数组的滚动相关系数(针对 [0, 1, 2, 3, 4] 的数据)。
我正在寻找使用 numpy (不是 pandas) 的更智能解决方案。
这是我当前的代码:
import numpy as np
data = np.array([10,5,8,9,15,22,26,11,15,16,18,7,4,8,-2,-3,-4,-6,-2,0,10,0,5,8])
x = np.zeros_like(data).astype('float32')
length = 5
for i in range(length, data.shape[0]):
    x[i] = np.corrcoef(data[i - length:i], np.arange(length))[0, 1]
print(x)
x 给出:
    [ 0.     0.     0.     0.     0.     0.607  0.959  0.98   0.328 -0.287
 -0.61  -0.314 -0.18  -0.8   -0.782 -0.847 -0.811 -0.825 -0.869 -0.283
  0.566  0.863  0.643  0.454]
有没有没有循环的解决方案?
最佳答案
使用 numpy.lib.stride_tricks.sliding_window_view (在 numpy v1.20.0+ 中可用)
swindow = np.lib.stride_tricks.sliding_window_view(data, (length,))
它提供了 data 数组的 View ,如下所示:
array([[10,  5,  8,  9, 15],
       [ 5,  8,  9, 15, 22],
       [ 8,  9, 15, 22, 26],
       [ 9, 15, 22, 26, 11],
       [15, 22, 26, 11, 15],
       [22, 26, 11, 15, 16],
       [26, 11, 15, 16, 18],
       [11, 15, 16, 18,  7],
       [15, 16, 18,  7,  4],
       [16, 18,  7,  4,  8],
       [18,  7,  4,  8, -2],
       [ 7,  4,  8, -2, -3],
       [ 4,  8, -2, -3, -4],
       [ 8, -2, -3, -4, -6],
       [-2, -3, -4, -6, -2],
       [-3, -4, -6, -2,  0],
       [-4, -6, -2,  0, 10],
       [-6, -2,  0, 10,  0],
       [-2,  0, 10,  0,  5],
       [ 0, 10,  0,  5,  8]])
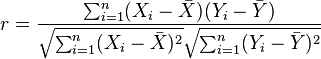
现在,我们要对该数组的每一行应用相关系数计算。不幸的是,np.corrcoef不采用axis参数,它将计算应用于整个矩阵,并且没有提供对每行/列执行此操作的方法。
但是,两个向量的相关系数的计算非常简单:
在这里应用:
def vec_corrcoef(X, y, axis=1):
    Xm = np.mean(X, axis=axis, keepdims=True)
    ym = np.mean(y)
    n = np.sum((X - Xm) * (y - ym), axis=axis)
    d = np.sqrt(np.sum((X - Xm)**2, axis=axis) * np.sum((y - ym)**2))
    return n / d
现在,使用我们的数组和arange调用此函数:
cc = vec_corrcoef(swindow, np.arange(length))
这给出了期望的结果:
array([ 0.60697698,  0.95894955,  0.98      ,  0.3279521 , -0.28709766,
       -0.61035663, -0.31390158, -0.17995394, -0.80041656, -0.78192905,
       -0.84702587, -0.81091772, -0.82464375, -0.86892667, -0.28347335,
        0.56568542,  0.86304424,  0.64326752,  0.45374261,  0.38135638])
要获取 x,只需设置正确大小的 zeros 数组的适当索引即可。
注意:我认为您的x应该包含从4索引开始的非零值(因为那是滑动窗口已满的地方)从索引 5 开始。
x = np.zeros(data.shape)
x[-len(cc):] = cc
如果您确定您的值应从索引 5 开始,那么您可以执行以下操作:
x = np.zeros(data.shape)
x[length:] = cc[:-1] # Ignore the last value in cc
将原始方法的运行时间与此处答案中建议的方法进行比较:
f_OP_loopy是您的方法,它使用循环实现滑动窗口f_PH_numpy是我的方法,它使用sliding_window_view和矢量化函数按行计算矢量相关系数f_RA_numpy是 Rontogiannis's approach ,它平铺arange,计算整个矩阵的相关系数,并仅选择最后一列的前len(data) - length行f_RA_recur是 Rontogiannis 的递归方法,但我没有计时,因为它错过了最后一个相关系数。

- 毫不奇怪,纯 numpy 解决方案比循环方法更快。
- 我的 numpy 解决方案计算行相关系数,比 Rontogiannis 显示的速度更快下面,因为我的方法避免了平铺向量输入和计算整个矩阵的相关性(仅丢弃不需要的元素)所涉及的额外工作。
- 随着输入数据大小的增加,Rontogiannis 方法中的这种“额外工作”增加得太多,以至于其运行时间甚至比循环方法更糟糕!我不确定这个额外时间是否在
np.corrcoef计算或在np.tile操作中。
注意:该图是在我的 2.2GHz i7 Macbook Air、8GB RAM、Python 3.10.7 和 numpy 1.23.3 上获得的。 Google Colab 上也获得了类似的结果

如果您对计时代码感兴趣,这里是:
import timeit
import numpy as np
from matplotlib import pyplot as plt

def time_funcs(funcs, sizes, arg_gen, N=20):
    times = np.zeros((len(sizes), len(funcs)))
    gdict = globals().copy()
    for i, s in enumerate(sizes):
        args = arg_gen(s)
        print(args)
        for j, f in enumerate(funcs):
            gdict.update(locals())
            try:
                times[i, j] = timeit.timeit("f(*args)", globals=gdict, number=N) / N
                print(f"{i}/{len(sizes)}, {j}/{len(funcs)}, {times[i, j]}")
            except ValueError:
                print(f"ERROR in {f}, with args=", *args)


    return times

def plot_times(times, funcs):
    fig, ax = plt.subplots()
    for j, f in enumerate(funcs):
        ax.plot(sizes, times[:, j], label=f.__name__)


    ax.set_xlabel("Array size")
    ax.set_ylabel("Time per function call (s)")
    ax.set_xscale("log")
    ax.set_yscale("log")
    ax.legend()
    ax.grid()
    fig.tight_layout()
    return fig, ax

#%%
def arg_gen(n):
    return [np.random.randint(-100, 100, (n,)), 5]

#%%
def f_OP_loopy(data, length):
    x = np.zeros_like(data).astype('float32')
    for i in range(length-1, data.shape[0]):
        x[i] = np.corrcoef(data[i - length + 1:i+1], np.arange(length))[0, 1]
    return x


def f_PH_numpy(data, length):
    swindow = np.lib.stride_tricks.sliding_window_view(data, (length,))
    cc = vec_corrcoef(swindow, np.arange(length))
    x = np.zeros(data.shape)
    x[-len(cc):] = cc
    return x

def f_RA_recur(data, length):
    return np.concatenate((
        np.zeros([length,]),
        rolling_correlation_recurse(data, 0, length)
    ))

def f_RA_numpy(data, length):
    n = len(data)
    cc = np.corrcoef(np.lib.stride_tricks.sliding_window_view(data, length), np.tile(np.arange(length), (n-length+1, 1)))[:n-length+1, -1]
    x = np.zeros(data.shape)
    x[-len(cc):] = cc
    return x
#%%

def rolling_correlation_recurse(data, i, length) :
    assert i+length < data.size
    left = np.array([np.corrcoef(data[i:i+length], np.arange(length))[0, 1]])
    if i+length+1 == data.size :
        return left
    right = rolling_correlation_recurse(data, i+1, length)
    return np.concatenate((left, right))

def vec_corrcoef(X, y, axis=1):
    Xm = np.mean(X, axis=axis, keepdims=True)
    ym = np.mean(y)
    n = np.sum((X - Xm) * (y - ym), axis=axis)
    d = np.sqrt(np.sum((X - Xm)**2, axis=axis) * np.sum((y - ym)**2))
    return n / d

#%%
if __name__ == "__main__":
    #%% Set up sim
    sizes = [5, 10, 50, 100, 500, 1000, 5000, 10_000] #, 50_000, 100_000]
    funcs = [f_OP_loopy, #f_RA_recur,
             f_PH_numpy, f_RA_numpy]


    #%% Run timing
    time_fcalls = np.zeros((len(sizes), len(funcs))) * np.nan
    time_fcalls = time_funcs(funcs, sizes, arg_gen)

    fig, ax = plot_times(time_fcalls, funcs)
    ax.set_xlabel(f"Input size")

    plt.show()
    input("Enter x to exit")
关于python - 如何使用numpy计算向量滚动窗口的相关系数?,我们在Stack Overflow上找到一个类似的问题: https://stackoverflow.com/questions/75072435/