所有,我正在使用 Matplotlib 绘制极坐标。但是刻度是重叠的。
有人知道如何避免这种情况吗?谢谢!
from pylab      import *

import matplotlib.pyplot as plt
from cf.plot    import BoundaryNorm,getBoundCmap
from matplotlib import colors

fig     = figure(figsize=(8,8))
ax      = fig.add_axes([0.1, 0.1, 0.8, 0.8], polar=True)

N = 8
theta   = np.arange(0.0, 2*np.pi, 2*np.pi/N)
radii   = ones((1,N)).squeeze()
width   = 2*np.pi/N
bars    = ax.bar(theta, radii, width=width, bottom=0.6)

listBnd = [0,3,6,9,12,15,18,21,24]

mcolors = plt.cm.Spectral(linspace(0,1,N))
cmap    = colors.ListedColormap(mcolors)

for r,bar in zip(arange(1,N+1), bars):
    bar.set_facecolor(cmap(r-1))

xlabels = array([0,21,18,15,12,9,6,3])
ax.xaxis.labelpad=50
ax.set_xticks(theta)
ax.set_xticklabels(xlabels,rotation=270,fontsize='60')
ax.xaxis.set_label_coords(0.5,-0.5)
ax.set_yticklabels([])
grid([])

show()
最佳答案
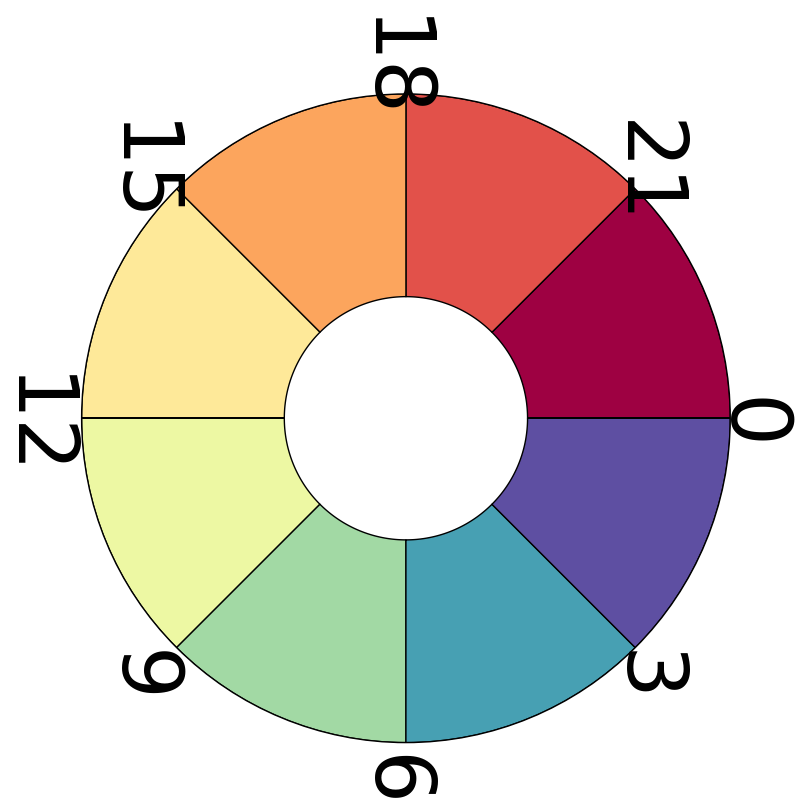
首先,让我们稍微清理一下您的代码。你有很多没有意义的东西。 (例如,为什么从颜色图中生成一个颜色列表,然后创建另一个颜色图,然后从另一个颜色图中获取您最初生成的颜色?)
此外,您设置的许多参数可能与您认为的不同。 (例如,轴的 labelpad 控制轴标签(例如 xlabel)的填充,而不是刻度。)
考虑到这一点,您的代码可能看起来像这样:
import numpy as np
import matplotlib.pyplot as plt

fig = plt.figure(figsize=(8,8))
ax = fig.add_subplot(111, projection='polar')

N = 8
theta = np.arange(0.0, 2*np.pi, 2*np.pi/N)
radii = np.ones(N)
width = 2 * np.pi / N
bars = ax.bar(theta, radii, width=width, bottom=0.6)

colors = plt.cm.Spectral(np.linspace(0, 1, N))

for color, bar in zip(colors, bars):
    bar.set_facecolor(color)

xlabels = np.array([0,21,18,15,12,9,6,3])
ax.set_xticks(theta)
ax.set_xticklabels(xlabels, rotation=270, fontsize=60)

ax.set_yticklabels([])
ax.grid(False)

plt.show()
生成类似于下图的图形:
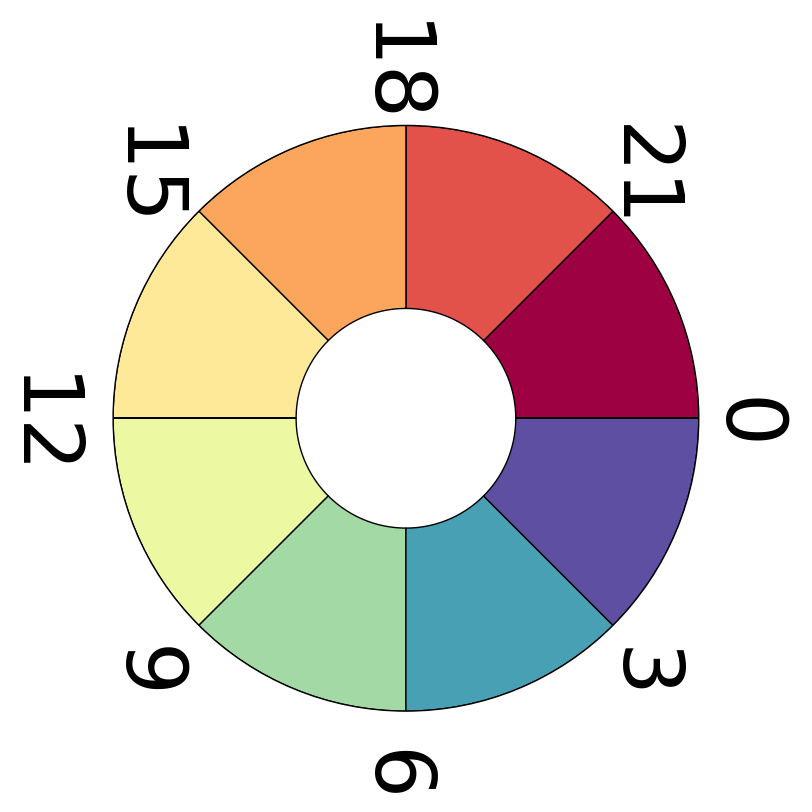
基本上,您想使用 frac 参数到 ax.set_thetagrids 来更改 theta 刻度标签的径向位置。 (这有点隐蔽,但这是最简单的方法。)
此外,我正在使用 fig.tight_layout 来调整大小,这样刻度标签就不会超出图形边界。
import numpy as np
import matplotlib.pyplot as plt

fig = plt.figure(figsize=(8,8))
ax = fig.add_subplot(111, projection='polar')

N = 8
theta = np.arange(0.0, 2*np.pi, 2*np.pi/N)
radii = np.ones(N)
width = 2 * np.pi / N
bars = ax.bar(theta, radii, width=width, bottom=0.6)

colors = plt.cm.Spectral(np.linspace(0, 1, N))

for color, bar in zip(colors, bars):
    bar.set_facecolor(color)

xlabels = np.array([0,21,18,15,12,9,6,3])
ax.set_thetagrids(np.degrees(theta), xlabels, frac=1.2,
                  rotation=270, fontsize=60)

ax.set_yticklabels([])
ax.grid(False)

fig.tight_layout()

plt.show()
关于python - 如何在 python 中为 xticklabels 添加空间?,我们在Stack Overflow上找到一个类似的问题: https://stackoverflow.com/questions/19993128/