我的条形图中有几种碳化合物,但我需要下标与每种化合物相关联的数字,例如C*12*-C*16*, C*17*-C*25*,C*26*-C*32*,C*33*-C*37*.
我正在尝试使用表达式函数,但在 barplot 上使用 names.arg 函数时效果不佳。请看到目前为止的代码:
barplot(t(as.matrix(alkane)),
  ylim=c(0,100),
  names.arg=c("C12-C16","C17-C25","C26-C32","C33-C37"),
  xlab="Hydrocarbons analysed after 21 days",
  ylab="% loss in concentration relative to day 0",
  cex.lab=0.8,
  cex.axis=0.8,
  cex.names=0.8,
  cex.main=0.8,
  beside=TRUE,
  col=c("blue","red"))
非常感谢任何帮助。
最佳答案
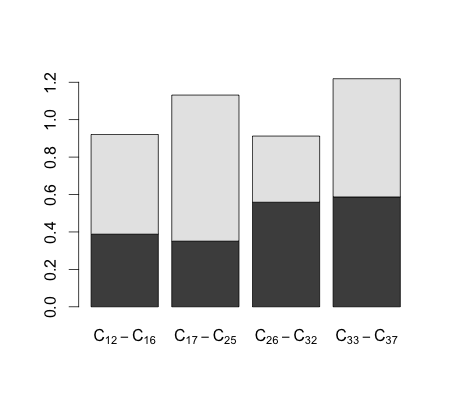
我想你正在寻找这个:
set.seed(1)
x <- matrix(rbeta(8, 5, 5), 2, 4)

barplot(x, names.arg =
          expression(C[12]-C[16], C[17]-C[25], C[26]-C[32],C[33]-C[37]))
关于r - 如何在 names.arg 函数中使用表达式,我们在Stack Overflow上找到一个类似的问题: https://stackoverflow.com/questions/21682089/