我目前有一个 nx3 矩阵数组。我想将三列绘制为三个轴。 我怎样才能做到这一点?
我用谷歌搜索过,有人建议使用 Matlab,但我真的很难理解它。我还需要它是一个散点图。
有人可以教我吗?
最佳答案
您可以使用 matplotlib为了这。 matplotlib 有一个 mplot3d模块,将完全按照您的意愿行事。
import matplotlib.pyplot as plt
import random
fig = plt.figure(figsize=(12, 12))
ax = fig.add_subplot(projection='3d')
sequence_containing_x_vals = list(range(0, 100))
sequence_containing_y_vals = list(range(0, 100))
sequence_containing_z_vals = list(range(0, 100))
random.shuffle(sequence_containing_x_vals)
random.shuffle(sequence_containing_y_vals)
random.shuffle(sequence_containing_z_vals)
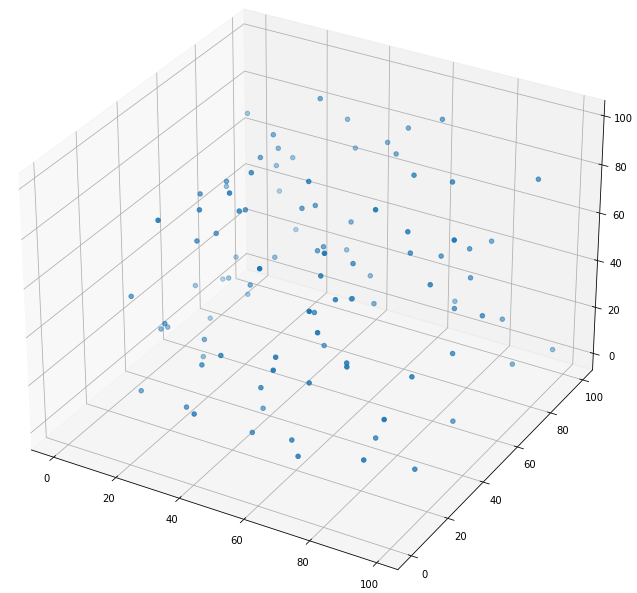
ax.scatter(sequence_containing_x_vals, sequence_containing_y_vals, sequence_containing_z_vals)
plt.show()
上面的代码生成如下图:
关于python - 如何在 matplotlib 中制作 3D 散点图,我们在Stack Overflow上找到一个类似的问题: https://stackoverflow.com/questions/1985856/