我最近写这个是为了抓取日志并显示其中最常用单词的 matplotlib.pyplot.bar 图
import re
from datetime import datetime
from collections import Counter

import matplotlib.pyplot as plt
from matplotlib import animation

def read_log(path, index, separator=chr(9)):
    data = []
    my_file = open(path,"r+")
    rows = my_file.readlines()
    for row in rows:
        line = re.sub(r'\r\n|\r|\n','',row, flags=re.M)
        if line != '':
            data.append(line.split(separator)[index])
    my_file.close()
    return Counter(data)

def set_plot(counter_data):
    plt.title('This is a title')
    plt.bar(range(len(counter_data)), list(counter_data.values()), align='center')
    plt.xticks(range(len(counter_data)), list(counter_data.keys()))
    plt.tight_layout()
    plt.show()

counter_data = read_log(r'logfile.txt',2)
print(counter_data)
set_plot(counter_data)
我很想为所述情节制作动画,但是,我无法理解 animation.FuncAnimation()
你能帮帮我吗?
我添加了这些行:
fig = plt.Figure()
animation.FuncAnimation(fig, set_plot(counter_data), frames=20)
并删除了plt.show()
所以我可以给 FuncAnimation 一个空图形 (fig) 和函数。但它不起作用。编辑:它也不会打印错误。
最佳答案
看起来你的数据是静态的(你从文件中获取一次并且它不会改变),所以我真的不明白你想要制作动画的是什么。但是,您的代码包含需要修复的错误,因此出于演示目的,我将在动画的每个步骤中添加每个高度的增量。
第一个错误是您将参数传递给函数的方式。对于参数,您必须使用 fargs 参数,否则在您的版本中,您传递的是函数的结果而不是函数本身。
您必须有一个函数(在我的版本中为 animate,在您的版本中为 set_plot)来更新动画的每个步骤的情节。 (在你的情况下,你每次都输入相同的数据)
该函数需要接受至少一个参数 (val),它用于我的 FuncAnimation,它将从迭代器获得的值传递给它的 frames 参数。
最终代码是这样的
import re
from datetime import datetime
from collections import Counter
import matplotlib.pyplot as plt
from matplotlib import animation
# uncomment if using in jupyter notebook
# %matplotlib nbagg
def read_log(path, index, separator=chr(9)):
data = []
my_file = open(path,"r+")
rows = my_file.readlines()
for row in rows:
line = re.sub(r'\r\n|\r|\n','',row, flags=re.M)
if line != '':
data.append(line.split(separator)[index])
my_file.close()
return Counter(data)
fig = plt.figure()
ax = fig.add_subplot()
counter_data = read_log(r'tmp.csv',2)
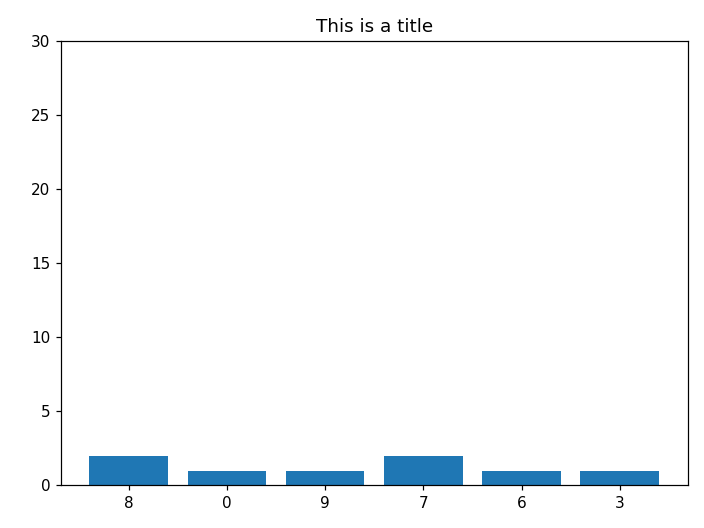
plt.title('This is a title')
bar = ax.bar(range(len(counter_data)), list(counter_data.values()), align='center')
plt.xticks(range(len(counter_data)), list(counter_data.keys()))
plt.tight_layout()
plt.ylim((0, 30))
def animate(val, counter_data):
data = list(counter_data.values())
for i in range(len(data)):
bar[i].set_height(data[i]+val)
animation.FuncAnimation(fig, func=animate, frames=20, fargs=[counter_data], save_count=10)
我们得到以下动画:
编辑:
对于错误你可以尝试将你的动画保存为gif,错误会显示出来
anim = animation.FuncAnimation(fig, func=animate, frames=20, fargs=[counter_data], save_count=10)
anim.save('anim.gif', 'imagemagick')
关于python - 动画条形图,我们在Stack Overflow上找到一个类似的问题: https://stackoverflow.com/questions/61082395/