我有一个多边形的 shapefile,我想找到每个多边形的质心,但我得到的是整个 shapefile 的质心。

我使用以下代码行将我的 csv 文件转换为 shapefile(参见这个问题 Converting CSV file to shapefile - but want polygon not points):
df <- as.data.frame(read_csv("/Users/alan/Desktop/shapes.csv"))
df1 <- lapply(split(df, df$shape), function(x) { coords <- as.matrix(cbind(x$longitude,
x$latitude)); rbind(coords, coords[1,])})
Coord_Ref <- st_crs(3035)
plot_locations_df <-  st_multipolygon(x=list(df1))
plot_locations_df <-  st_sfc(plot_locations_df, crs = Coord_Ref)
plot(st_geometry(plot_locations_df))
plot(st_geometry(plot_locations_df, col = sf.colors(12, categorical=TRUE), border='grey',
axes=TRUE))
plot(st_geometry(st_centroid(plot_locations_df)), pch = 3, col = 'red', add=TRUE)
我的数据框是这样的:
structure(list(shape = c(1.1, 1.1, 1.1, 1.1, 2.1, 2.1, 2.1, 2.1,
3.1, 3.1, 3.1, 3.1, 4.1, 4.1, 4.1, 4.1, 5.1, 5.1, 5.1, 5.1, 6.1,
6.1, 6.1, 6.1, 7.1, 7.1, 7.1, 7.1, 8.1, 8.1, 8.1, 8.1, 9.1, 9.1,
9.1, 9.1), longitude = c(43, 43, 40, 40, 23, 23, 20, 20, 25,
25, 38, 38, 25, 25, 38, 38, 45, 50, 50, 45, 65, 60, 60, 65, 60,
60, 80, 80, 60, 60, 80, 80, 20, 20, 80, 80), latitude = c(10,
13, 13, 10, 10, 13, 13, 10, 10, 10.3, 10.3, 10, 12.7, 13, 13,
12.7, 13, 13, 10, 10, 13, 13, 10, 10, 9.8, 9.5, 9.5, 9.8, 6,
5.7, 5.7, 6, 5, 4.5, 4.5, 5)), row.names = c(NA, 36L), class = "data.frame")
最佳答案
这里有两个不同的问题。首先,您用来创建 sf 对象的方法会导致几何无效(st_is_valid(plot_locations_df) 返回 FALSE)。要获得有效的 MULTIPOLYGON,您可以使用:
df1 <- lapply(split(df, df$shape), function(x) { coords <- as.matrix(cbind(x$longitude,
x$latitude)); list(rbind(coords, coords[1,]))})
names(df1)<- NULL
Coord_Ref <- st_crs(3035)
plot_locations_df <-  st_sfc(st_multipolygon(x=df1), crs = Coord_Ref)

st_is_valid(plot_locations_df)
[1] TRUE
但是,这仍然无济于事,因为您的几何图形仍然是一个多边形(即由多个多边形组成的单个要素),并且多边形的质心是一个点,计算时考虑了它的所有多边形。
plot_locations_df
> Geometry set for 1 feature
> geometry type:  MULTIPOLYGON
> dimension:      XY
> bbox:           xmin: 20 ymin: 4.5 xmax: 80 ymax: 13
> projected CRS:  ETRS89-extended / LAEA Europe
> MULTIPOLYGON (((43 10, 43 13, 40 13, 40 10, 43 ...

st_centroid(plot_locations_df)
> Geometry set for 1 feature
> geometry type:  POINT
> dimension:      XY
> bbox:           xmin: 49.10736 ymin: 8.969325 xmax: 49.10736 ymax: 8.969325
> projected CRS:  ETRS89-extended / LAEA Europe
> POINT (49.10736 8.969325)
为了得到你想要的,你必须通过重新转换为 POLYGON 来分割多边形:
plot_locations_df <- st_cast(plot_locations_df, "POLYGON")
plot_locations_df
> Geometry set for 9 features
> geometry type: POLYGON
> dimension: XY
> bbox: xmin: 20 ymin: 4.5 xmax: 80 ymax: 13
> projected CRS: ETRS89-extended / LAEA Europe
> First 5 geometries:
> POLYGON ((43 10, 43 13, 40 13, 40 10, 43 10))
> POLYGON ((23 10, 23 13, 20 13, 20 10, 23 10))
> POLYGON ((25 10, 25 10.3, 38 10.3, 38 10, 25 10))
> POLYGON ((25 12.7, 25 13, 38 13, 38 12.7, 25 12...
> POLYGON ((45 13, 50 13, 50 10, 45 10, 45 13))
st_centroid(plot_locations_df)
> Geometry set for 9 features
> geometry type: POINT
> dimension: XY
> bbox: xmin: 21.5 ymin: 4.75 xmax: 70 ymax: 12.85
> projected CRS: ETRS89-extended / LAEA Europe
> First 5 geometries:
> POINT (41.5 11.5)
> POINT (21.5 11.5)
> POINT (31.5 10.15)
> POINT (31.5 12.85)
> POINT (47.5 11.5)
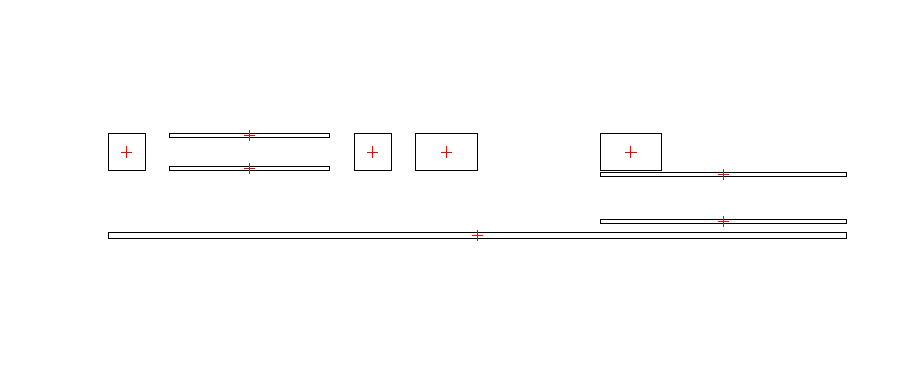
plot(st_geometry(plot_locations_df))
plot(st_geometry(plot_locations_df, col = sf.colors(12, categorical=TRUE), border='grey',
axes=TRUE))
plot(st_geometry(st_centroid(plot_locations_df)), pch = 3, col = 'red', add=TRUE)
喂!
关于r - 如何使用 sf 库查找多边形的质心,我们在Stack Overflow上找到一个类似的问题: https://stackoverflow.com/questions/62342564/