我正在尝试为旋转的立方体制作动画。为此,我使用 Poly3DCollection 并使用 FuncAnimation 对其进行动画处理:
anim = animation.FuncAnimation(fig, visualize_rotation, fargs=[collection],
                               init_func=partial(init_func, ax, collection),
                               frames=360, interval=1000 / 30)
但它渲染每一帧的速度非常慢,所以我每秒只能得到几帧。为了修复它,我尝试添加参数 blit=True,希望它能提高渲染速度,但这样我就看不到立方体了。
这是我在窗口中看到的:
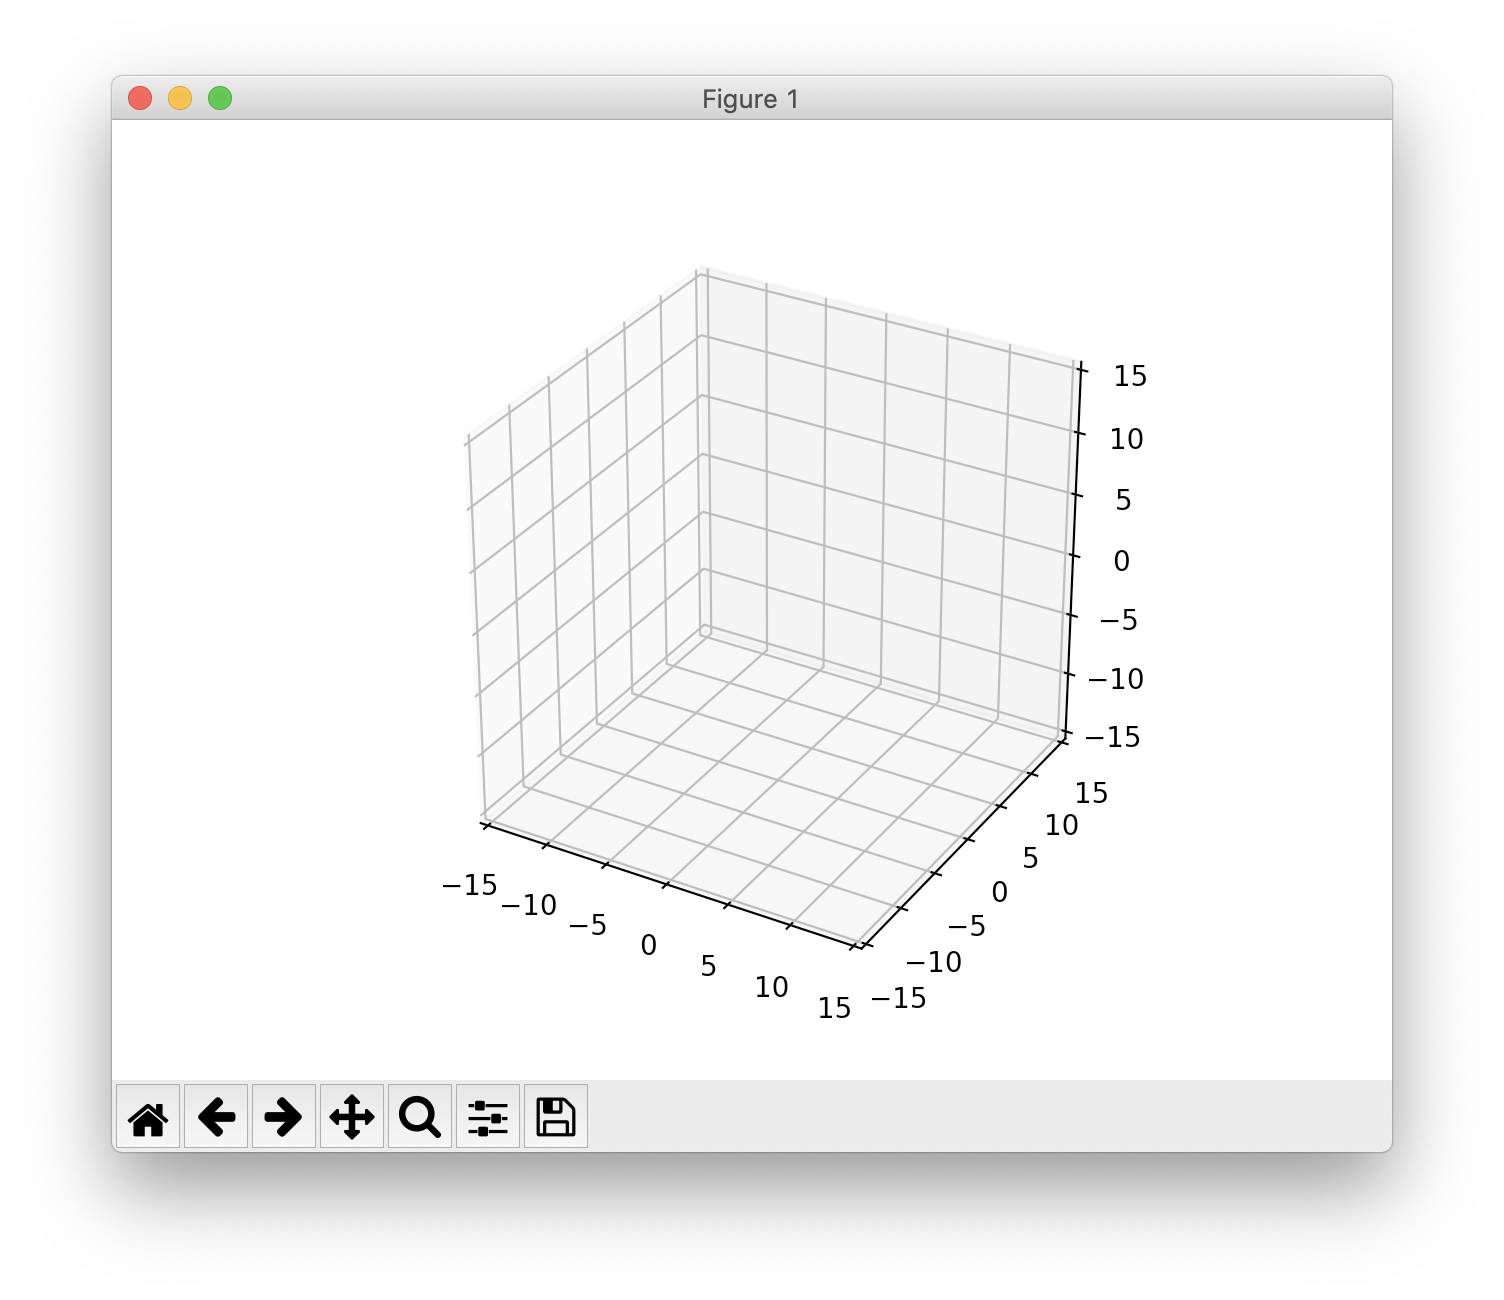
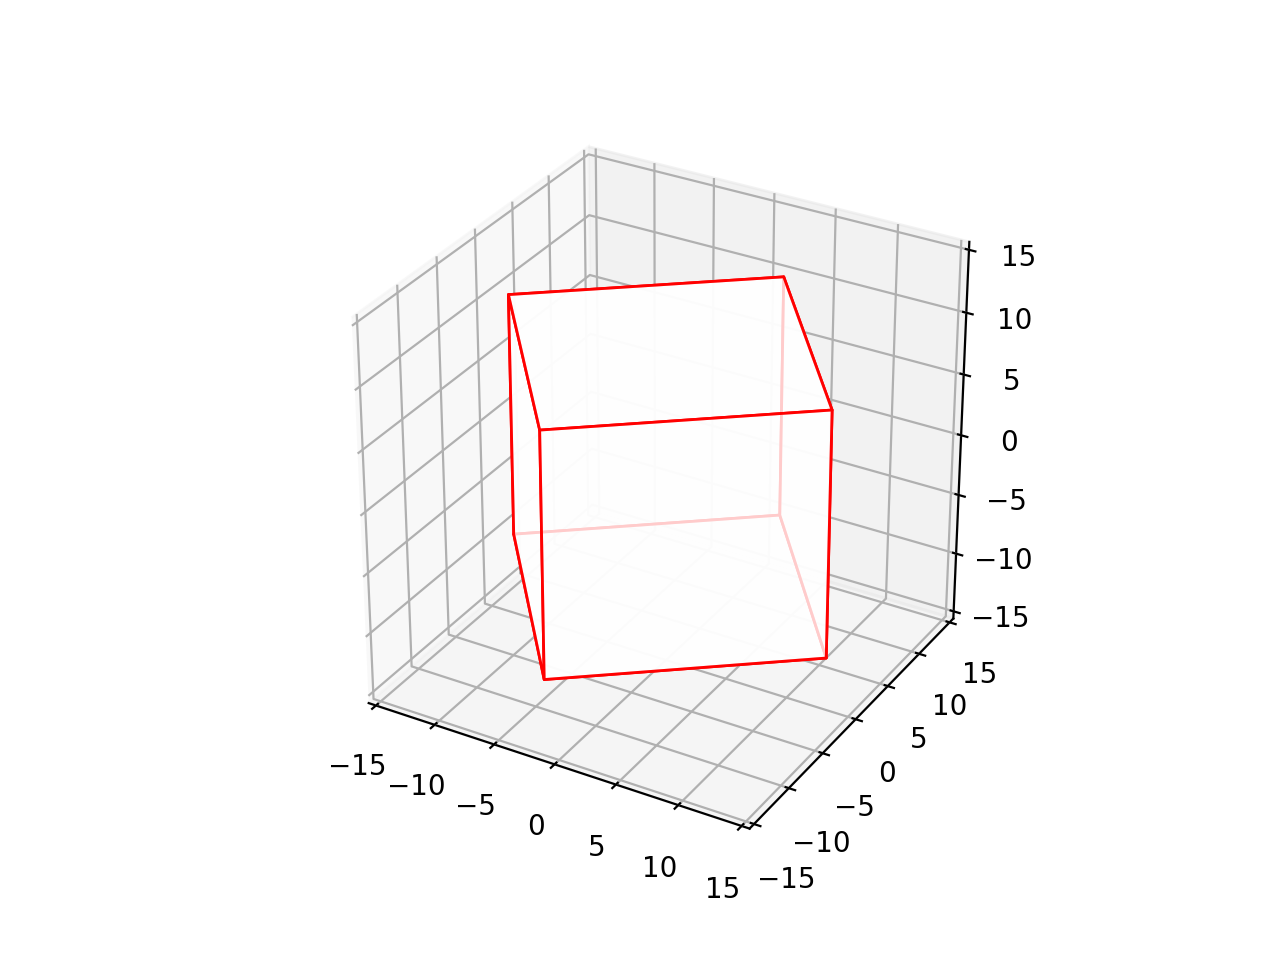
奇怪的是,保存图形时立方体是可见的。这是我得到的结果:
我确保 visualize_rotation 返回 [collection] 的艺术家列表,这是 blit=True 所要求的,如 this question 中所述, 但立方体仍然不可见。
那么,在这种情况下,如何使用 blit 标志,同时能够在动画期间看到立方体?
完整代码:
import math
from functools import partial

import matplotlib.pyplot as plt
import numpy as np
from matplotlib import animation
from mpl_toolkits.mplot3d.art3d import Poly3DCollection

def visualize_rotation(frame, collection):
    angle = math.radians(2) * frame

    points = np.array([[-1, -1, -1],
                       [1, -1, -1],
                       [1, 1, -1],
                       [-1, 1, -1],
                       [-1, -1, 1],
                       [1, -1, 1],
                       [1, 1, 1],
                       [-1, 1, 1]])

    Z = np.zeros((8, 3))
    for i in range(8):
        Z[i, :] = [
            math.cos(angle) * points[i, 0] - math.sin(angle) * points[i, 1],
            math.sin(angle) * points[i, 0] + math.cos(angle) * points[i, 1],
            points[i, 2]
        ]
    Z = 10.0 * Z

    # list of sides' polygons of figure
    vertices = [[Z[0], Z[1], Z[2], Z[3]],
                [Z[4], Z[5], Z[6], Z[7]],
                [Z[0], Z[1], Z[5], Z[4]],
                [Z[2], Z[3], Z[7], Z[6]],
                [Z[1], Z[2], Z[6], Z[5]],
                [Z[4], Z[7], Z[3], Z[0]]]

    # plot sides
    collection.set_verts(vertices)
    print(frame)

    return [collection]

def init_func(ax, collection):
    ax.set_xlim(-15, 15)
    ax.set_ylim(-15, 15)
    ax.set_zlim(-15, 15)

    ax.set_box_aspect(np.ptp([ax.get_xlim(), ax.get_ylim(), ax.get_zlim()], axis=1))

    return [collection]

def animate_rotation():

    fig = plt.figure()
    ax = fig.add_subplot(111, projection='3d', proj_type='persp')

    collection = Poly3DCollection([[np.zeros(3)]], facecolors='white',
                                  linewidths=1, edgecolors='r', alpha=0.8)
    ax.add_collection3d(collection)

    # noinspection PyUnusedLocal
    anim = animation.FuncAnimation(fig, visualize_rotation, fargs=[collection],
                                   init_func=partial(init_func, ax, collection),
                                   frames=360, interval=1000 / 30, blit=True)

    plt.show()
编辑:
我添加了每秒帧数的计算并绘制了它:
timestamps = []

def visualize_rotation(frame, collection):
    ...

    # plot sides
    collection.set_verts(vertices)
    global timestamps

    timestamps.append(time.time())
    print(round(1 / np.mean(np.diff(timestamps[-1000:])), 1))

    return [collection]

def animate_rotation():
    ...

    plt.plot(np.diff(timestamps))
    plt.ylim([0, 0.1])
    plt.show()
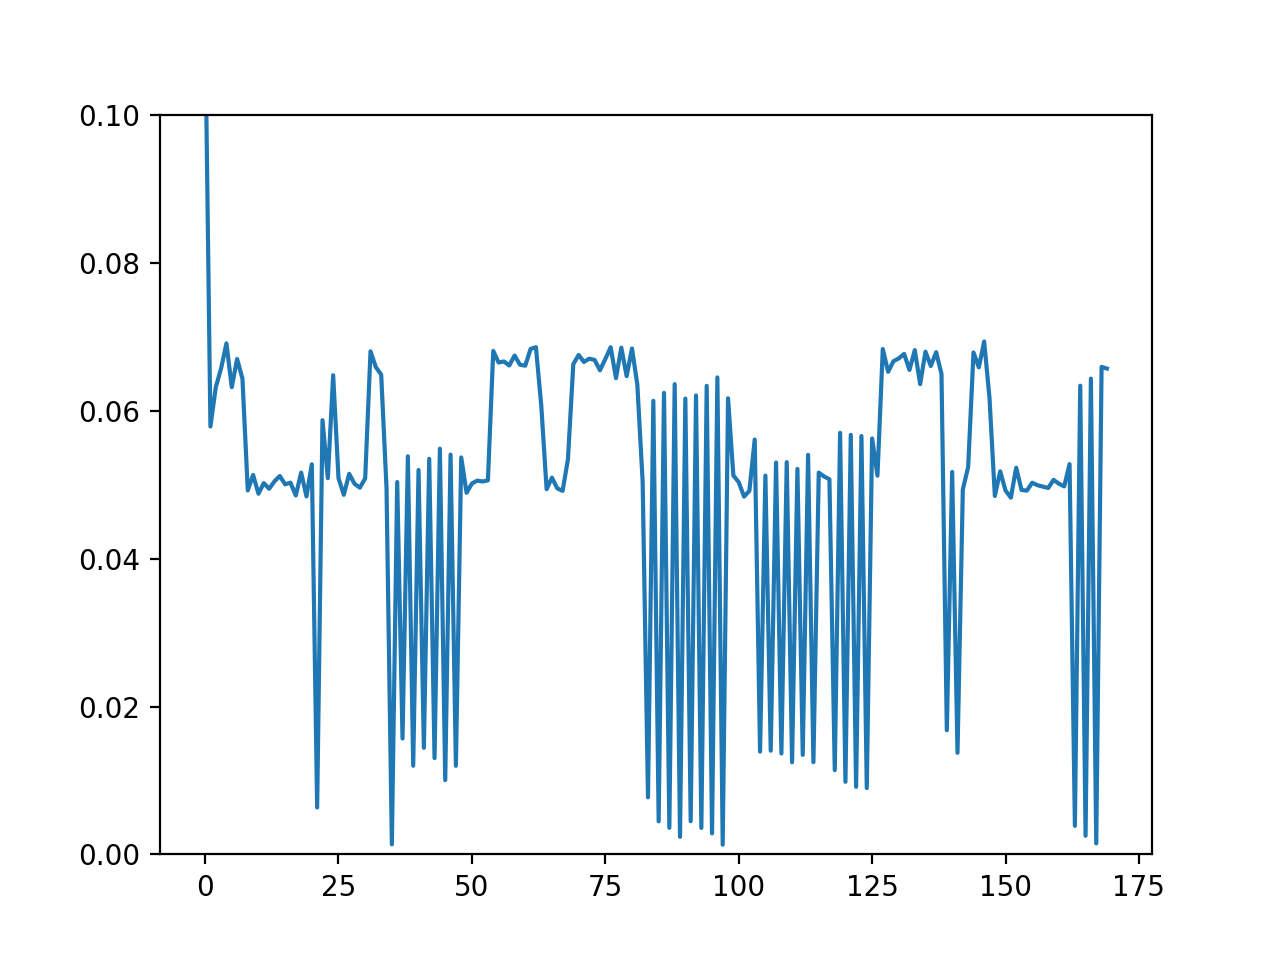
这是当窗口为正常大小且绘图速度较慢时发生的情况(以秒为单位的时间与帧数):
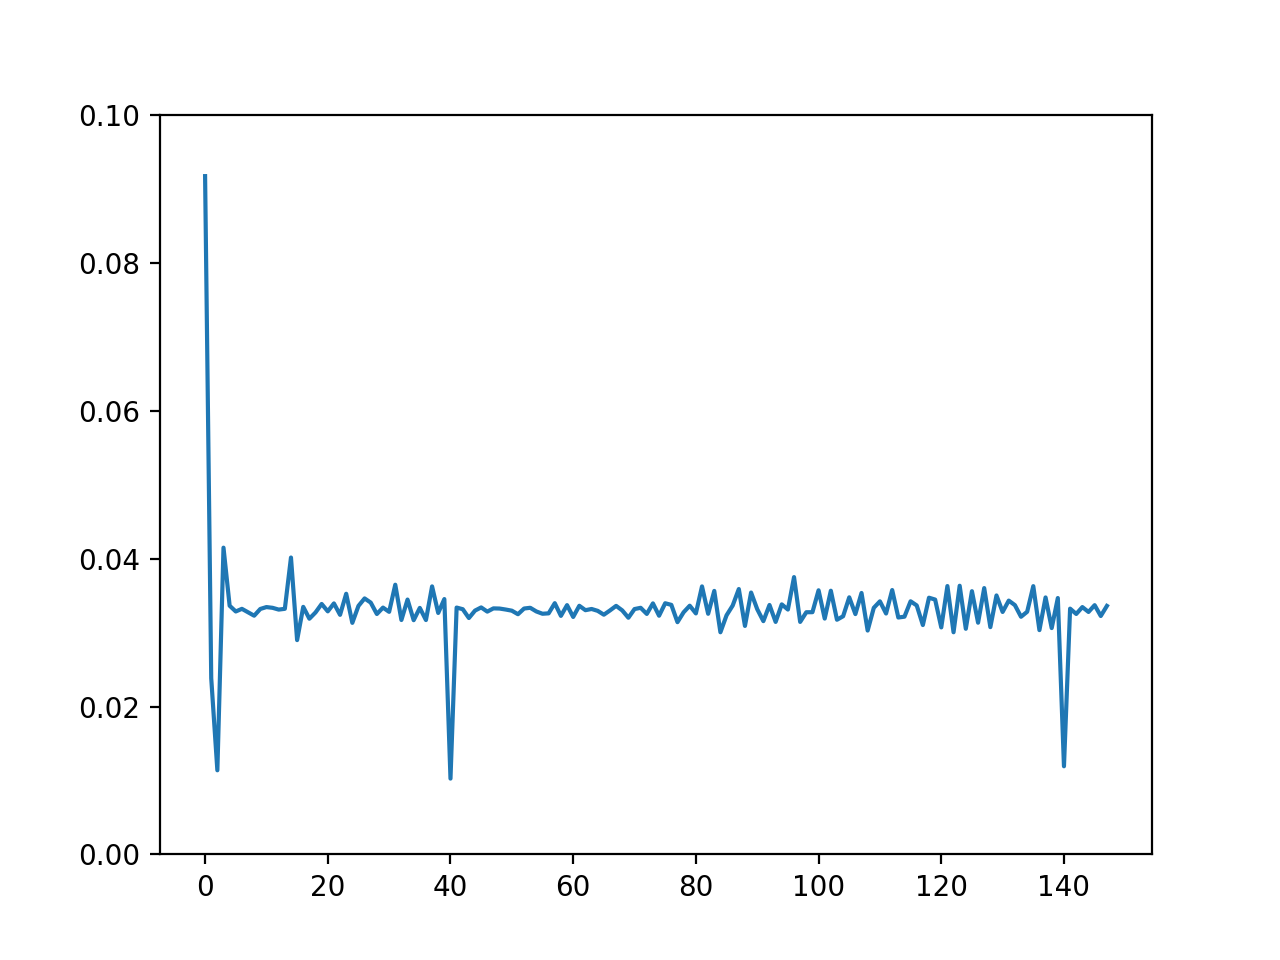
这是窗口很小时的情节:
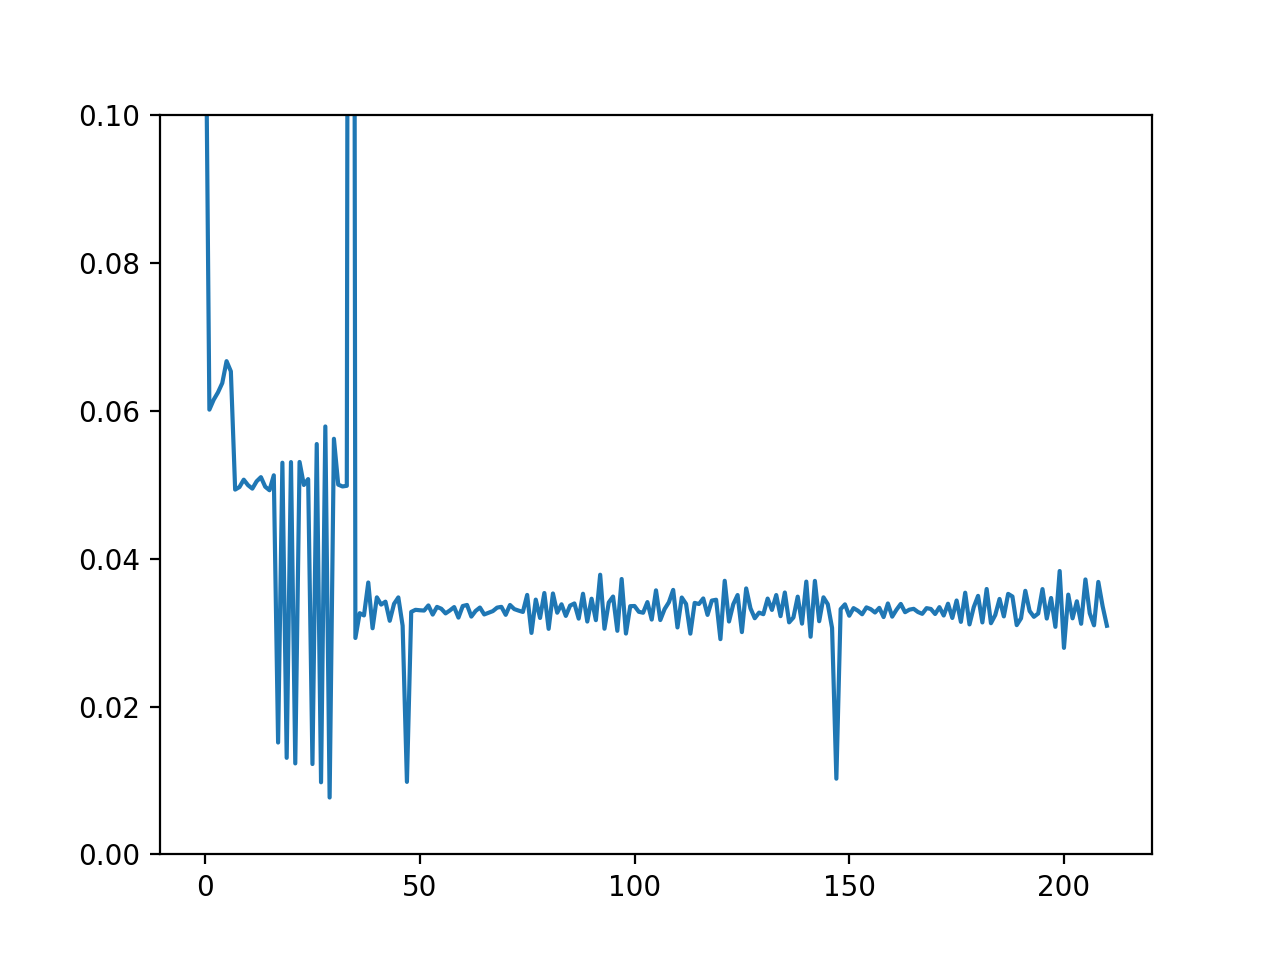
绘图的开头显示了窗口大小的调整。在第二种情况下,只有 2 帧被丢弃(大约 50 和 150),总体帧速率约为 30 fps,符合要求。当窗口正常大小时,我正在寻找相同类型的行为。当我打开 blit 时,情节看起来不错,但问题是立方体不可见。
最佳答案
我为您找到了一个单线修复:在更新顶点后添加 do_3d_projection。
...
# plot sides
collection.set_verts(vertices)
collection.do_3d_projection(collection.axes.get_figure().canvas.get_renderer())
print(frame)

return [collection]
当blit=True时,底层代码没有调用它,这可能是一个错误。
此外,还会弹出另一个错误;当动画在 blit=True 模式下重复时,最后一帧以某种方式被保留。要解决此问题,请在您的 init_func 中添加 ax.clear() 和 ax.add_collection3d():
def init_func(ax, collection):
    ax.clear()
    ax.add_collection3d(collection)
    ax.set_xlim(-15, 15)
    ax.set_ylim(-15, 15)
    ...
关于python - 如何使用带 blit=True 的 FuncAnimation 为 Poly3DCollection 设置动画?,我们在Stack Overflow上找到一个类似的问题: https://stackoverflow.com/questions/66113220/