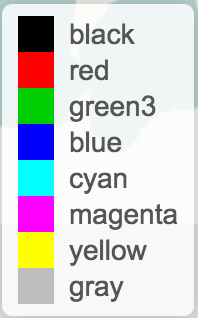
我在使用 viridis 调色板绘制图例的颜色时遇到问题:尽管图例标签显示,但颜色未显示。
我在 Ubuntu 下使用 Shiny Server v1.4.2.786 和 Node.js v0.10.40 测试了相同的代码(它不显示 viridis 颜色)并且在 MacOS 下(它正确)。
Ubuntu R session 的详细信息:
R version 3.3.1 (2016-06-21)
Platform: x86_64-pc-linux-gnu (64-bit)
Running under: Ubuntu 15.10

leaflet_1.0.1 shiny_0.13.2  viridis_0.3.4
这是不显示颜色的图例
    leaflet() %>% addTiles() %>% addLegend(
      position = 'bottomright',
      colors = viridis(8),
      labels = viridis(8), opacity = 1)
虽然这也适用于 Ubuntu 机器
    leaflet() %>% addTiles() %>% addLegend(
      position = 'bottomright',
      colors = rgb(t(col2rgb(palette())) / 255),
      labels = palette(), opacity = 1)
这似乎确实是 viridis 调色板的颜色代码有问题(我尝试将它们复制/粘贴到字符向量中)。
一个工作示例
library(shiny)
library(leaflet)
library(viridis)

r_colors <- rgb(t(col2rgb(colors()) / 255))
names(r_colors) <- colors()

ui <- fluidPage(
  leafletOutput("mymap")
)

server <- function(input, output, session) {

  output$mymap <- renderLeaflet({
    leaflet() %>% addTiles() %>% addLegend(
      position = 'bottomright',
      colors = viridis(8),
      labels = viridis(8), opacity = 1)

  })
}

shinyApp(ui, server)
最佳答案
这与 viridis 调色板的 Alpha channel #xxxxxxFF 有关。在将 viridis 设置为 mapview 包的默认调色板时,我遇到了同样的问题。我写了一个小函数来解决这个问题。该函数未导入到命名空间中,因此您只能通过mapview:::col2Hex访问它。其定义为:
function(col, alpha = FALSE) {

  mat <- grDevices::col2rgb(col, alpha = TRUE)
  if (alpha) {
    hx <- grDevices::rgb(mat[1, ]/255, mat[2, ]/255,
                         mat[3, ]/255, mat[4, ]/255)
  } else {
    hx <- grDevices::rgb(mat[1, ]/255, mat[2, ]/255, mat[3, ]/255)
  }
  return(hx)

}
来源可以找到here .
这样,您的代码就应该可以工作了。
leaflet() %>% addTiles() %>% addLegend(
    position = 'bottomright',
    colors = mapview:::col2Hex(viridis(8)),
    labels = mapview:::col2Hex(viridis(8)), opacity = 1)
尝试将 alpha 设置为 TRUE,最终会得到没有颜色的结果:
leaflet() %>% addTiles() %>% addLegend(
    position = 'bottomright',
    colors = mapview:::col2Hex(viridis(8), alpha = TRUE),
    labels = mapview:::col2Hex(viridis(8), alpha = TRUE), opacity = 1)
关于r - Shiny 服务器: leafet doesn't display viridis colors in legend,我们在Stack Overflow上找到一个类似的问题: https://stackoverflow.com/questions/40067403/

