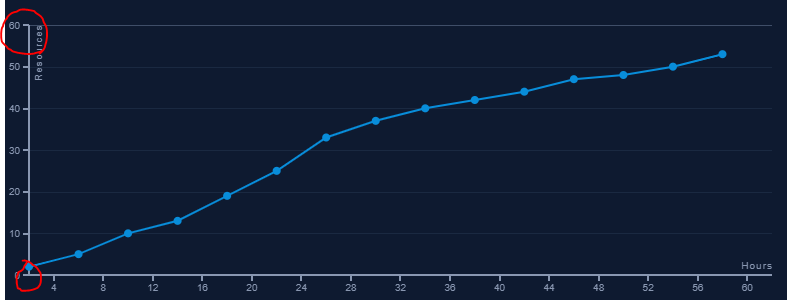
(i) 我正在尝试删除 y 轴结束刻度,但 tickSizeOuter(0) 在这种情况下对我没有帮助。
(ii) 我还想在 y 轴结束刻度值 (60) 之后有一些填充,类似于 x 轴。我尝试了 padding 和 paddingOuter 但这对我没有帮助。
这是 stackblitz .
这是我的代码:
maxAllowed = 60;
  graphData = [
    {
      hrCount: 4,
      resCount: 2
    },
    {
      hrCount: 8,
      resCount: 5
    },
    {
      hrCount: 12,
      resCount: 10
    },
    ...
const margin = { top: 25, right: 25, bottom: 25, left: 25 };
    const width =
      document.getElementById("svgcontainer").parentElement.offsetWidth -
      (margin.left + margin.right);
    const height =
      document.getElementById("svgcontainer").parentElement.offsetHeight -
      (margin.top + margin.bottom);

    // Remove any existing SVG
    d3.select("#svgcontainer")
      .selectAll("svg > *")
      .remove();

    // Group
    const g = d3
      .select("#svgcontainer")
      .append("svg")
      .attr("width", width + margin.left + margin.right)
      .attr("height", height + margin.top + margin.bottom)
      .append("g")
      .attr("transform", "translate(" + margin.left + ", " + margin.top + ")");

    // Scale
    // x-scale
    const xScale = d3
      .scaleBand()
      .domain(this.graphData.map((d: any) => d.hrCount))
      .range([0, width]);
    // y-scale
    const yScale = d3
      .scaleLinear()
      .domain([0, this.maxAllowed])
      .range([height, 0]);

    // y-axis gridline
    g.append("g")
      .attr("class", "y-axis-grid")
      .call(
        d3
          .axisLeft(yScale)
          .tickSize(-width)
          .tickFormat("")
          .ticks(5)
      );

    // Axis
    // x-axis
    const xAxis = d3.axisBottom(xScale).tickSizeOuter(0);
    g.append("g")
      .attr("transform", "translate(0, " + height + ")")
      .attr("class", "graph-axis")
      .call(xAxis.scale(xScale))
      .append("text")
      .attr("x", width)
      .attr("y", -6)
      .attr("text-anchor", "end")
      .attr("font", "10px sans-serif")
      .attr("letter-spacing", "1px")
      .attr("fill", "#8997b1")
      .text("Hours");
    // y-axis
    const yAxis = d3
      .axisLeft(yScale)
      .ticks(5)
      .tickSizeOuter(0);
    g.append("g")
      .attr("class", "graph-axis")
      .call(yAxis.scale(yScale))
      .append("text")
      .attr("transform", "rotate(-90)")
      .attr("y", 6)
      .attr("dy", ".71em")
      .style("text-anchor", "end")
      .attr("font", "10px sans-serif")
      .attr("letter-spacing", "1px")
      .attr("fill", "#8997b1")
      .text("Resources");

    // Data line
    const line = d3
      .line()
      .x((d: any) => xScale(d.hrCount))
      .y((d: any) => yScale(d.resCount));
    const path = g
      .append("path")
      .attr("fill", "none")
      .attr("stroke", "#088dda")
      .attr("stroke-width", "2px")
      .attr("d", line(this.graphData));
    // Transition
    const totalLength = path.node().getTotalLength();
    path
      .attr("stroke-dasharray", totalLength + " " + totalLength)
      .attr("stroke-dashoffset", totalLength);
    path
      .transition()
      .duration(4000)
      .attr("stroke-dashoffset", 0);

    // Data dots
    g.selectAll("line-circle")
      .data(this.graphData)
      .enter()
      .append("circle")
      .attr("r", 4)
      .attr("fill", "#088dda")
      .attr("cx", (d: any) => xScale(d.hrCount))
      .attr("cy", (d: any) => yScale(d.resCount));
  }
最佳答案
我检查了您的代码并提出了以下方法来解决您的问题。
您可以通过将 y 轴域映射到数据中存在的最大值 + 一些填充高度(我采用了 5)来将顶部填充添加到图表中。 为此需要进行的更改:
maxAllowed = 0;

this.maxAllowed = d3.max(this.graphData, d => d.hrCount) + 5; // max value + padding

// y-scale
const yScale = d3
  .scaleLinear()
  .domain([0, this.maxAllowed])
  .range([height, 0]);
对于要删除最外面的 tickSize 的第二个更改,您可以使用 .tickSizeOuter(0); 轻松完成它。问题是您看不到此更改,因为 tickSizeOuter 为零那些没有相应 y 刻度值的刻度线的值(y 轴的终点有一些刻度 y 值)。
但是如果您标记 this.maxAllowed = 65 的值并删除 tickSizeOuter(0) 那么您将能够看到 y 轴的末端没有 y 刻度值,但其刻度线向外延伸。在这些情况下,我们使用 tickSizeOuter(0) 来移除刻度线。
IMO 你应该只使用它,不应该删除 0 值的刻度线。它会导致不必要的结果。但是,如果您仍想删除 0 值的刻度线。您可以使用以下代码并将其从 svg 中删除:
d3.selectAll(".y-axes-tick .tick line").each(function(d, i) {
  debugger;
  if (i === 0) {
    this.remove();
  }
});
请在这里找到 working stackblitz
关于d3.js - 使用 tickSizeOuter(0) 删除 y 轴结束刻度不起作用,我们在Stack Overflow上找到一个类似的问题: https://stackoverflow.com/questions/64980593/