我有对话中说话者的话语以及他们彼此注视的数据。说话者的注视在 A_aoi、B_aoi 和 C_aoi 列中,注视持续时间在 A_aoi_dur 中,B_aoi_dur 和 C_aoi_dur。以下是可重现的数据片段:
df0 <- structure(list(Line = c(105L, 106L, 107L, 109L, 110L, 111L, 112L,
113L, 114L, 115L, 116L), Speaker = c("ID01.A", NA, "ID01.A",
NA, "ID01.B", NA, "ID01.A", NA, "ID01.A", NA, "ID01.C"), Utterance = c("so you've ↑obviously↑ thought about it obviously: (.) have made a decision (.) I'm !head!ing in this door (.) one of the cleaning ladies at the UB !grabb!ed my elbow",
"(0.662)", "and said (.) ~no no no !this! is the !womens'! bathroom~=",
"(0.015)", "=((v: gasps))=", "(0.166)", "=NOW", "(0.622)", "!how! this always plays out ",
"(0.726)", "[when was] that¿="), UttStart = c(163898L, 172500L,
173162L, 176100L, 176115L, 176800L, 176966L, 177372L, 177994L,
179328L, 180054L), UttEnd = c(172500, 173162, 176100, 176115,
176800, 176966, 177372, 177994, 179328, 180054, 180668), UttDur = c(8602,
662, 2938, 15, 685, 166, 406, 622, 1334, 726, 614), A_aoi = c("*B*C*B*C*B*C*B*C*B*C",
"C*", "*B*C*C", "C", "C*", "*", "*C", "C", "C*B", "B*", "*"),
    A_aoi_dur = c("21,516,79,333,200,634,233,651,17,2332,33,400,33,518,17,532,33,1900,119,1",
    "414,248", "1124,412,116,533,600,153", "15", "616,69", "166",
    "153,253", "622", "204,151,979", "219,507", "614"), B_aoi = c("A*A*A*A*A",
    "A", "A", "A", "A", "A", "A", "A*", "*A*A", "A*A", "A*A"),
    B_aoi_dur = c("475,130,567,137,1983,313,787,1400,2810", "662",
    "2938", "15", "685", "166", "406", "398,224", "76,136,284,838",
    "108,571,47", "116,270,228"), C_aoi = c("A", "A", "A*A*A",
    "A", "A", "A", "A", "A*A", "A", "A*A", "A"), C_aoi_dur = c("8602",
    "662", "1058,123,1300,144,313", "15", "685", "166", "406",
    "264,351,7", "1334", "125,323,278", "614")), row.names = c(NA,
-11L), class = c("tbl_df", "tbl", "data.frame"))
编辑:具有时间重叠 话语的新测试数据:
df0 <- structure(list(Line = 137:145,
                      Speaker = c("ID01.A", "ID01.A-Q", NA, "ID01.A", "ID01.A-Q", "ID01.A-Q", "ID01.A-Q", "ID01.A-Q",NA),
                      Utterance = c("↑she gra:bs my elbow (.) I turn to !look! at her↑ and she's like ~this is a (.) womens' bathroom you can't go in there~",
                                     "~this is a (.) womens' bathroom you can't go in there~", "(0.534)",
                                     "and I'm like ~((silent f: blank stare))~ (.) and she didn't, she was just like ~you can't go in~ (.) I'm like ~I'm a !woman!~ she said ~no you're not you can't go in~",
                                     "~((silent f: blank stare))~", "~you can't go in~", "~I'm a !woman!~",
                                     "~no you're not you can't go in~", "(0.487)"),
                      UttStart = c(208845L, 211450L, 214136L, 214670L, 215409L, 218307L, 219235L, 220076L, 221368L),
                      UttEnd = c(214136, 214136, 214670, 221368, 217117, 219050, 219885, 221368, 221855),
                      UttDur = c(5291, 2686, 534, 6698, 1708, 743, 650, 1292, 487),
                      A_aoi = c("C*B*C*C*B*C*", "C*B*C*", "*B", "B*C*B*C*C*B*B", "C*B", "C*B", "*", "*B","B"),
                      A_aoi_dur = c("57,445,1100,135,199,333,866,302,832,33,468,521","530,302,832,33,468,521",
                                    "144,390", "377,235,466,399,1268,132,268,132,433,6,716,1412,854","339,399,970", "73,6,664", "650", "438,854", "487"),
                      B_aoi = c("A*A","A", "A", "A*A*A*A*A*A", "A", "*A*A", "*A", "A*A", "A"),
                      B_aoi_dur = c("1691,121,3479", "2686", "534", "53,180,3333,134,253,280,203,534,1296,138,294",
                                    "1708", "63,253,280,147", "405,245", "860,138,294", "487"),
                      C_aoi = c("A", "A", "A", "A*A", "A", "A*", "A", "A", "A"),
                      C_aoi_dur = c("5291", "2686", "534", "3766,734,2198",
                                       "1708", "129,614", "650", "1292", "487")),
                 row.names = c(NA, -9L), class = c("tbl_df", "tbl", "data.frame"))
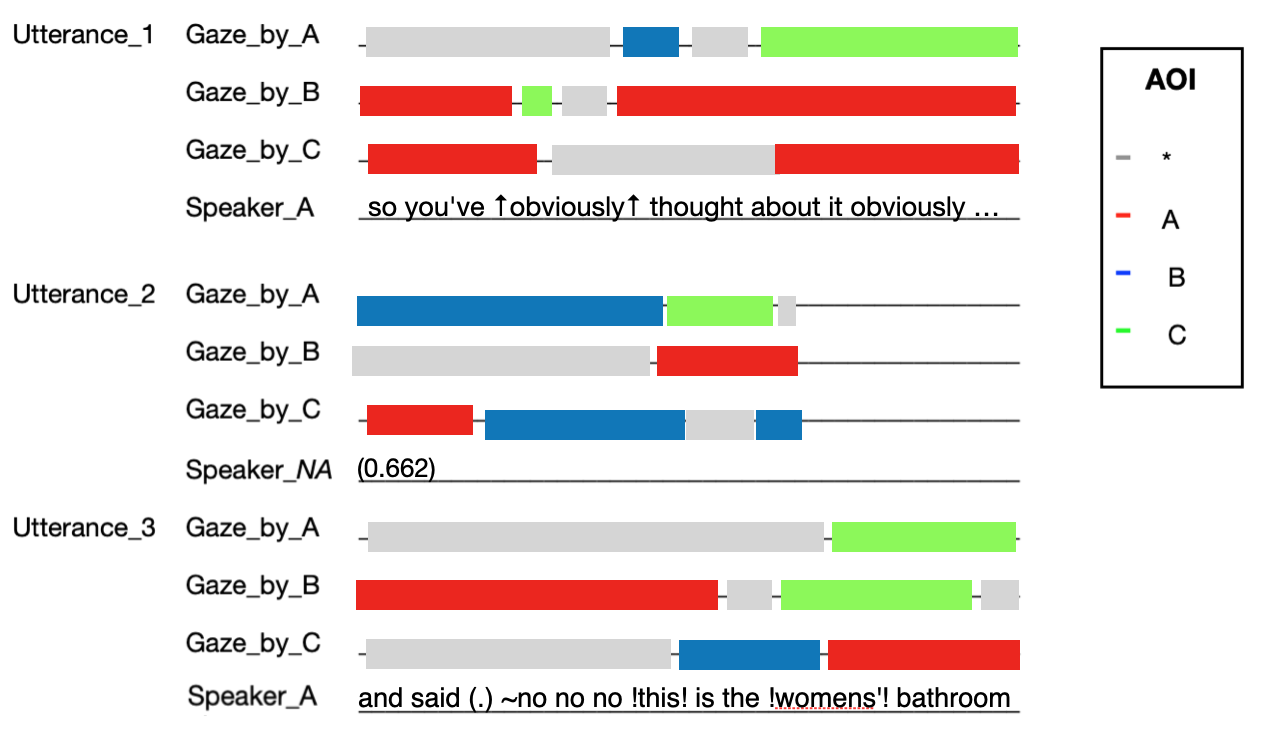
我希望能够可视化的是,每个 Utterance 是谁在看谁,看多长时间,大致如下图所示:
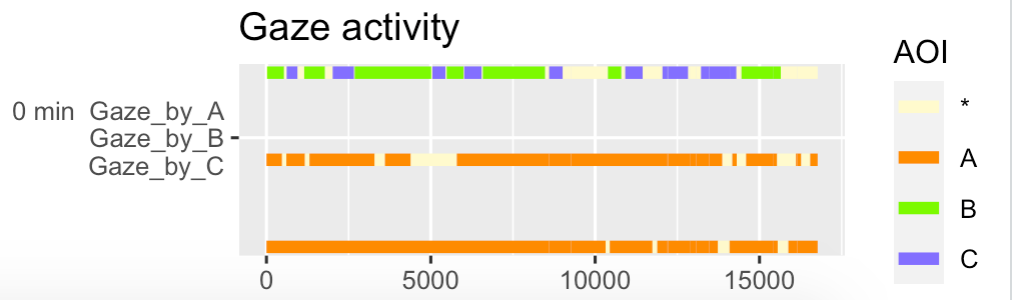
我目前能做的是以分钟为单位绘制注视,但只是注视 - 而不是话语:Plotting gaze movements by multiple speakers in a single plot .从上面的数据开始,这可以通过多次转换(如下所示)来实现,但是生成的图不包含话语,而是绘制每分钟的注视,而我需要注视per Utterance:
我完全知道这要求很高。非常感谢您提供帮助。
# pivot_longer so that all gazes have their own row:
df0 <- df0 %>%
  rename_with(~ str_c(., "_AOI"), ends_with("_aoi")) %>%
  pivot_longer(cols = contains("_"),
               names_to = c("Gaze_by", ".value"),  #
               names_pattern = "^(.*)_([^_]+$)"
  ) %>%
  mutate(Gaze_by = sub("^(.).*", "\\1", Gaze_by)) %>%
  mutate(AOI = str_replace_all(AOI, "(?<=.)(?=.)", ",")) %>%
  separate_rows(c(AOI, dur), sep = ",", convert = TRUE)

# compute starttimes and endtimes for gazes:
df1 <- df0 %>%
  group_by(Gaze_by) %>%
  mutate(
    end = cumsum(dur),
    start = end - dur
  )
View(df1)

# compute minutes:
df2 <- df1 %>%
  mutate(
    # which minute does the event start in?
    minute_start = as.integer(start/60000),
    # which minute does the event end in?
    minute_end = as.integer(end/60000),
    # does the event straddle a minute mark?
    straddler = minute_end > minute_start)
View(df2)


# 1st subset of `df2`:
df2_A1 <- df2 %>%
  # filter those rows that contain events straddling minute marks:
  filter(straddler=="TRUE") %>%
  # reduce the endtime to the exact minute mark:
  mutate(end = minute_end*60000)
View(df2_A1)

# 2nd subset of `df2`:
df2_A2 <- df2 %>%
  # filter those rows that contain events straddling minute marks:
  filter(straddler=="TRUE") %>%
  # reduce the starttime to the exact minute mark:
  mutate(start = minute_end*60000)
View(df2_A2)

# 3rd subset of `df0`:
df2_A3 <- df2 %>%
  # filter those rows that do not contain events straddling minute marks:
  filter(!straddler == "TRUE")
View(df2_A3)

# row-bind all three subsets:
df4 <- rbind(df2_A1, df2_A2, df2_A3) %>%
  arrange(start) %>%
  mutate(
    minute = as.integer(start/60000),
    # reduce total starttimes to starttimes per minute:
    start_pm = start - 60000*minute,
    # reduce total endtimes to endtimes per minute:
    end_pm = end - 60000*minute)

# plot gaze activity for **ALL** speakers:
df4 %>%
  ggplot(aes(x = start_pm,
             xend = end_pm,
             y = minute + scale(as.numeric(as.factor(Gaze_by))) / 6,
             yend = minute + scale(as.numeric(as.factor(Gaze_by))) / 6,
             color = AOI)) +
  # draw segments for AOI:
  geom_segment(size = 2) +
  # reverse y-axis scale:
  scale_y_reverse(breaks = 0:max(df4$minute),
                  labels = paste(0:max(df4$minute), "min", " Gaze_by_A\n Gaze_by_B\n Gaze_by_C", sep = " "),
                  name = NULL) +
  # define custom colors:
  scale_colour_manual(values = c("*" = "lemonchiffon",
                                 "A" = "darkorange",
                                 "B" = "lawngreen",
                                 "C" = "slateblue1")) +
  # plot title:
  labs(title = "Gaze activity") +
  theme(axis.title.x.bottom = element_blank())
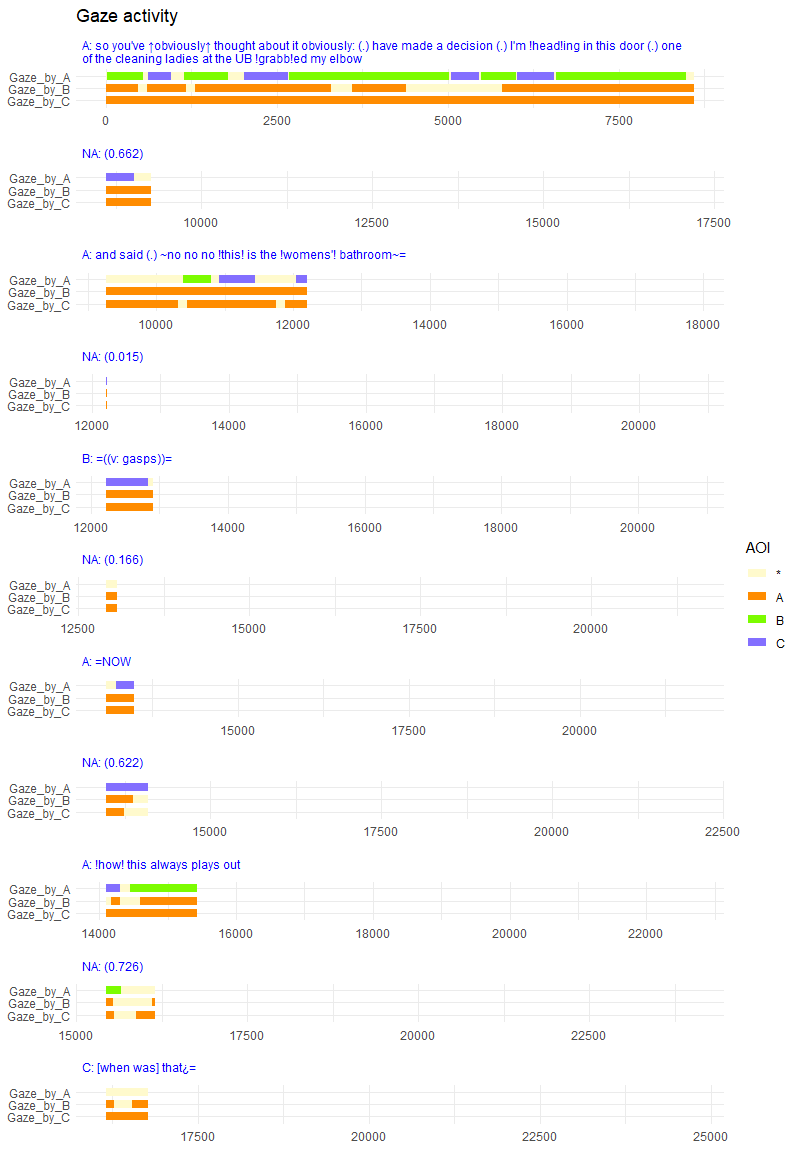
最佳答案
这是一个接近您正在寻找的解决方案,它利用了方面。它还使用 forcats::fct_reorder 和 stringr::str_wrap(它们都是 tidyverse 的一部分)。
这还会包装任何长话语并使所有方面的 x 比例保持相同,而不是让它们拉伸(stretch)以填充宽度。
df4 %>%
  mutate(#add text for y axis labels
         Gaze_by = paste0("Gaze_by_", Gaze_by),
         #reorder facet panels, add speaker at start, and wrap to 120 characters
         Utterance = fct_reorder(str_wrap(paste0(substr(Speaker, 6, 6), ": ",
                                                 Utterance),
                                          120),
                                 start_pm),
         #set a dummy end point for each utterance based on the longest one
         max_x = UttStart - min(UttStart) + max(UttDur)) %>%
  ggplot(aes(x = start_pm, xend = end_pm,
             y = Gaze_by, yend = Gaze_by,               #as discrete variable
             color = AOI)) +
  geom_segment(size = 3) +
  geom_point(aes(x = max_x, y = Gaze_by), alpha = 0) +  #plot invisible dummy end points
  scale_y_discrete(name = NULL, limits = rev) +         #rev to get A at the top
  facet_wrap(~Utterance, scales = "free_x", ncol = 1) +
  scale_colour_manual(values = c("*" = "lemonchiffon",
                                 "A" = "darkorange",
                                 "B" = "lawngreen",
                                 "C" = "slateblue1")) +
  labs(title = "Gaze activity") +
  theme_minimal() +                                     #removes a lot of lines etc
  theme(strip.text = element_text(color = "blue", hjust = 0), #facet strip text
        strip.background = element_rect(fill = "white", color = "white"),
        axis.title.x.bottom = element_blank())
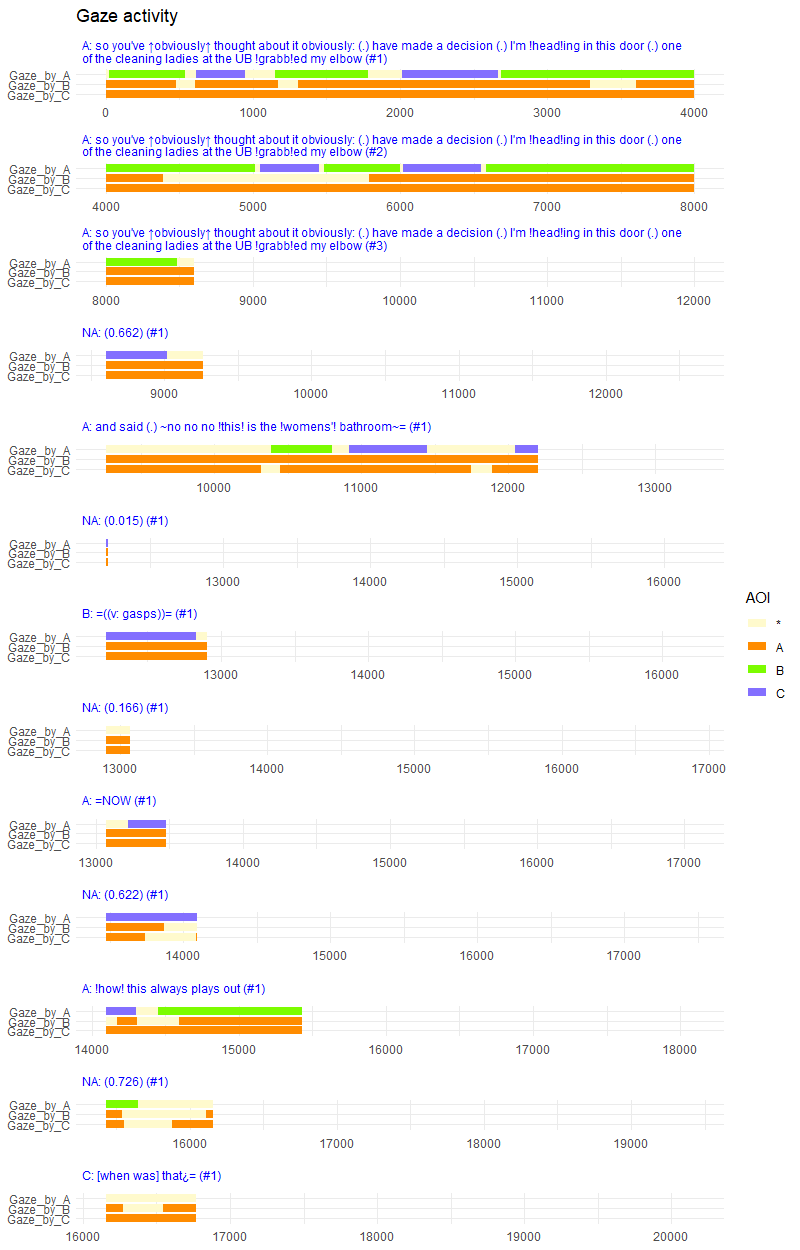
要将话语切成 4 秒的 block ,您可以这样做...
df4 %>% group_by(Utterance) %>%
  #work out relative durations from start of utterance and create subutterances
  mutate(relStart = start_pm - min(start_pm),
         relEnd = end_pm - min(start_pm),
         subNo = map2(relStart, relEnd, ~seq(.x %/% 4000, .y %/% 4000, 1))) %>%
  unnest(subNo) %>% #expand one row per subutterance
  mutate(Utterance = paste0(Utterance, " (#", subNo + 1, ")"), #add sub no
         subStart = pmax(4000 * subNo, relStart),   #limits on subUtt
         subEnd = pmin(4000 * (subNo + 1), relEnd), #limits on subUtt
         start_pm = min(start_pm) + subStart,   #redefine start
         end_pm = min(start_pm) + subEnd) %>%   #redefine end
  group_by(Utterance) %>%   #regroup as Utterance has changed!
  mutate(max_x = min(start_pm) + 4000) %>%      #define dummy end points
  ungroup() %>%
  mutate(Gaze_by = paste0("Gaze_by_", Gaze_by),
         Utterance = fct_reorder(str_wrap(paste0(substr(Speaker, 6, 6), ": ", Utterance),
                                          120), start_pm)) %>%
  ggplot(...)   #...as per code above from this point
关于r - ggplot2 中的语音注视事件图,我们在Stack Overflow上找到一个类似的问题: https://stackoverflow.com/questions/68374987/