我正在尝试删除 R Plotly 图中工具提示中的误差条值。
我尝试使用此处的 hovertext 参数:https://plot.ly/r/hover-text-and-formatting/但无法让它工作。
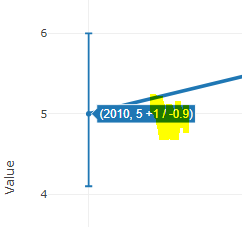
我在一个函数中有这些,有时有错误栏,但大多数时候没有(因为我没有数据),所以不需要工具提示中的额外细节(因为它只是显示+0/-0)。
在下面的示例中,我希望它只显示 2010, 5 而没有置信区间。
有什么想法吗?
library(tidyverse)
library(plotly)

data <- tibble(x = c(2010, 2011, 2012),
               y = c(5, 6, 7),
               err_high = c(1, 1, 1),
               err_low = c(0.9, 1, 1.1))

#plotly graph
plot_ly() %>%
  add_trace(data = data,  x = ~x, y = ~y,
            name = 'Actual', type = 'scatter', mode = 'lines+markers',
            line = list(shape = 'linear', width= 4, dash = 'solid'),
            error_y = list(type = "data", symmetric = FALSE, array = ~err_high, arrayminus = ~err_low)) %>%
  layout(xaxis = list(title = 'Year'),
         yaxis = list (title = 'Value', rangemode = "tozero"))
最佳答案
您可以包含
 text=paste(data$x, data$y, sep=', '),
 hoverinfo='text',
在 add_trace() 中获取:
plotly :

完整代码:
library(tidyverse)
library(plotly)

data <- tibble(x = c(2010, 2011, 2012),
               y = c(5, 6, 7),
               err_high = c(1, 1, 1),
               err_low = c(0.9, 1, 1.1))

#plotly graph
plot_ly() %>%
  add_trace(data = data,  x = ~x, y = ~y,
            name = 'Actual', type = 'scatter', mode = 'lines+markers',
            line = list(shape = 'linear', width= 4, dash = 'solid'),
            text=paste(data$x, data$y, sep=', '),
            hoverinfo='text',
            error_y = list(type = "data", symmetric = FALSE, array = ~err_high, arrayminus = ~err_low)) %>%
  layout(xaxis = list(title = 'Year'),
         yaxis = list (title = 'Value', rangemode = "tozero"))
关于r - Plotly:如何删除工具提示中的置信区间值(从误差栏中)?,我们在Stack Overflow上找到一个类似的问题: https://stackoverflow.com/questions/59098612/