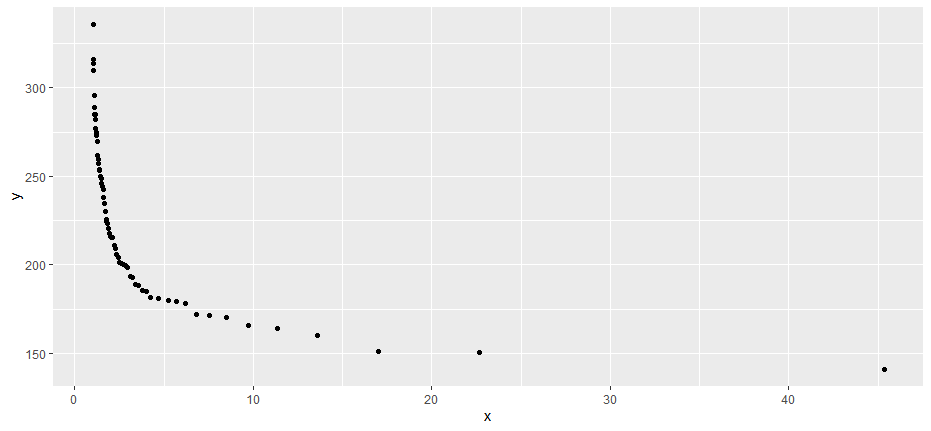
我正在尝试使用 R 中的 ggplot 在公式 y ~ a*x^b 中绘制幂回归线。
看起来我需要使用 stat_smooth 下的 method = "nls",但收到一条警告消息,指出在评估模型时会产生缺失值或无穷大值。
如果我从数据中排除一些点,我可以让它工作,但我看不出这些点和工作点之间有任何区别 这是怎么回事?
数据
library(dplyr)
library(ggplot2)
mydf <- structure(list(x = c(3.09090909090909, 1.09677419354839, 1.47826086956522,
                             2.125, 5.23076923076923, 2.42857142857143, 45.3333333333333,
                             2.3448275862069, 2.51851851851852, 45.3333333333333, 6.18181818181818,
                             1.78947368421053, 9.71428571428572, 13.6, 2.95652173913043, 4,
                             11.3333333333333, 1.51111111111111, 3.23809523809524, 6.8, 22.6666666666667,
                             5.66666666666667, 1.83783783783784, 2.61538461538462, 1.30769230769231,
                             1.7, 7.55555555555556, 1.03030303030303, 2, 1.88888888888889,
                             1.17241379310345, 1.13333333333333, 1.4468085106383, 8.5, 2.26666666666667,
                             1.01492537313433, 1.61904761904762, 3.57894736842105, 4.68965517241379,
                             2.19354838709677, 3.77777777777778, 17, 4.25, 1.07936507936508,
                             1.33333333333333, 1.74358974358974, 1.28301886792453, 2.06060606060606,
                             4.68965517241379, 1.94285714285714, 2.83333333333333, 1.04615384615385,
                             2.72, 1.58139534883721, 1.23636363636364, 1.41666666666667, 1.65853658536585,
                             1.15254237288136, 1.11475409836066, 1.38775510204082, 1.0625,
                             1.36, 3.4, 1.19298245614035, 1.21428571428571, 1.25925925925926,
                             1.54545454545455), y = c(193.571428571429, 289, 249, 215.285714285714,
                                                      179.857142857143, 204, 141.142857142857, 206.142857142857, 201.428571428571,
                                                      141.142857142857, 178.285714285714, 224.714285714286, 165.714285714286,
                                                      160, 198.428571428571, 184.857142857143, 164.285714285714, 245.857142857143,
                                                      192.714285714286, 172, 150.714285714286, 179.142857142857, 223.571428571429,
                                                      200.714285714286, 259.285714285714, 230, 171.714285714286, 315.714285714286,
                                                      216, 220.571428571429, 277, 285, 250, 170.285714285714, 209.142857142857,
                                                      335.714285714286, 238.285714285714, 188.571428571429, 181.142857142857,
                                                      210.857142857143, 185.714285714286, 151.142857142857, 181.428571428571,
                                                      295.857142857143, 257.142857142857, 225.857142857143, 261.714285714286,
                                                      215.714285714286, 181.142857142857, 217.857142857143, 199.714285714286,
                                                      313.571428571429, 200.428571428571, 242.857142857143, 269.714285714286,
                                                      250.142857142857, 234.857142857143, 282, 285.142857142857, 253.285714285714,
                                                      309.857142857143, 253.857142857143, 189.142857142857, 274.714285714286,
                                                      273.285714285714, 261.857142857143, 244.142857142857)), row.names = c(NA, -67), class = "data.frame")
我的代码:
mydf %>%
      ggplot(aes(x = x, y = y))+
      geom_point()+
      stat_smooth(
            method = "nls",
            formula = "y~a*x^b",
            method.args = list(start= c(a = 1,b=1)),
            se=FALSE
      )
# Warning message:
#       Computation failed in `stat_smooth()`:
#       Missing value or an infinity produced when evaluating the model
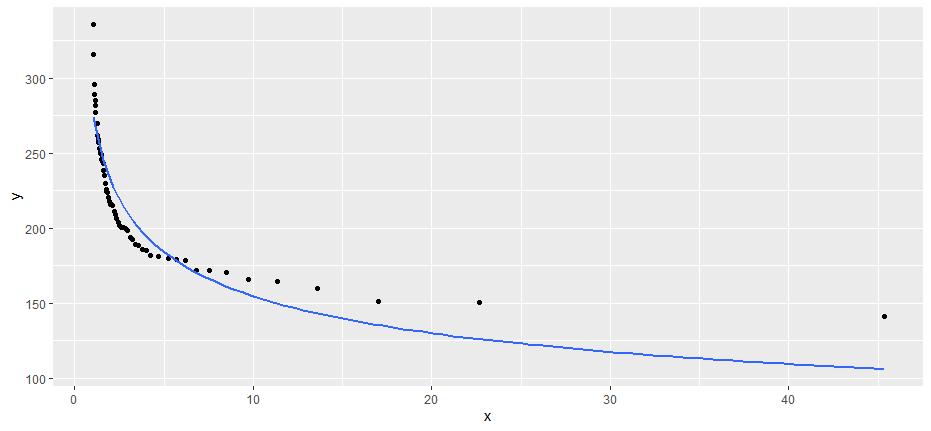
 如果我排除选定的点,它会起作用:
mydf_trunc <- mydf[c(1:51, 53:58, 60, 63, 67),]

mydf_trunc%>%
      ggplot(aes(x = x, y = y))+
      geom_point()+
      stat_smooth(
            method = "nls",
            formula = "y~a*x^b",
            method.args = list(start= c(a = 1,b=1)),
            se=FALSE
      )
 但我看不出有效的点和引起问题的点之间有什么区别。图中红点是导致 stat_smooth 失败的点
bad_pts <- mydf[c(52,59, 61, 62, 64, 65, 66),]
bad_pts
# # A tibble: 7 x 2
# x     y
# <dbl> <dbl>
# 1  1.05  314.
# 2  1.11  285.
# 3  1.06  310.
# 4  1.36  254.
# 5  1.19  275.
# 6  1.21  273.
# 7  1.26  262.
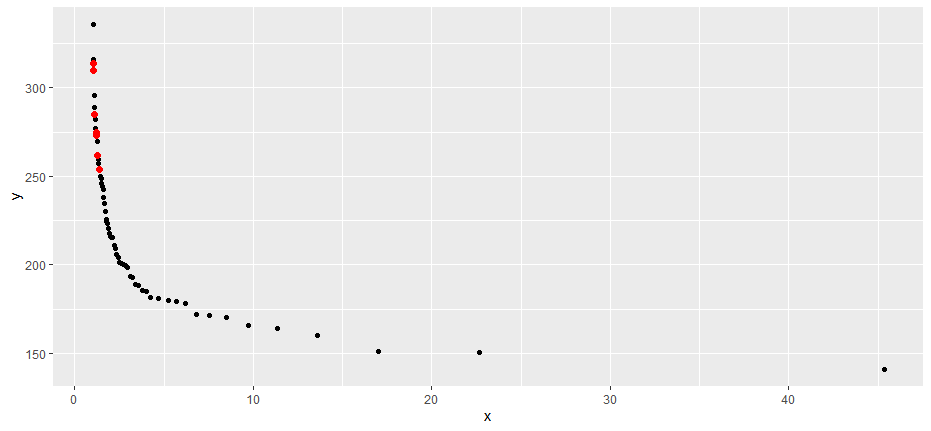 警告消息表明这些点导致缺失值或无限值,但它们似乎与其余点沿着相同的曲线拟合,并且没有任何缺失值。
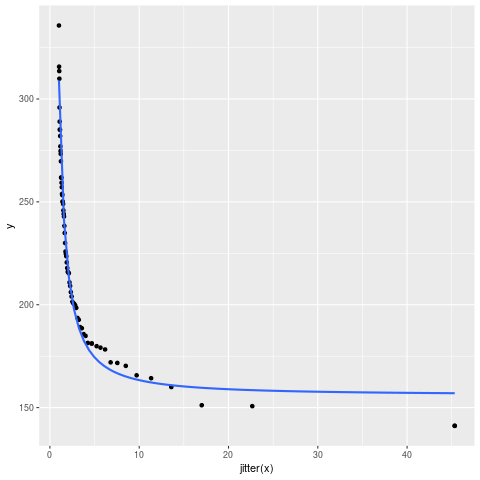
最佳答案
我怀疑a)有问题的点是其他一些点的重复,至少对于它们的x值来说是这样,因此在估计过程的某些部分给你无限的斜率,并且b)渐近线应该允许在上面零:
ggplot(data=mydf, aes(x = jitter(x), y = y))+
    geom_point()+
    geom_smooth(
        method="nls",
        formula= y~ a*x^(-b) +cc,
        method.args = list(start= c(a = 1,b=2 ,cc=100)),
        se=FALSE
    )
关于r - 使用选择点绘制功效回归时 stat_smooth 出现错误,我们在Stack Overflow上找到一个类似的问题: https://stackoverflow.com/questions/59329935/