我有一组数据,基本上是f(x)作为x的函数和x本身的信息。从问题的理论中我知道我正在研究 f(x) 的格式,其表达式如下:

本质上,我想用这组数据来求出参数a和b。我的问题是:我该怎么做?我应该使用什么库?我想要一个使用 Python 的答案。但 R 或 Julia 也可以。
从我迄今为止所做的一切来看,我读到了一个名为 curve fit 的功能。来自 SciPy 库,但只要我的 x 变量位于积分限制之一,我就会以哪种形式执行代码时遇到一些麻烦。
为了更好地解决问题,我还有以下资源:
A sample set ,我知道我正在寻找的参数。对于这个集合,我知道 a = 2 且 b = 1(且 c = 3)。在它提出一些关于我如何知道这些参数的问题之前:我知道它们是因为我使用上面方程积分中的这些参数创建了这个样本集,只是为了使用样本来研究如何找到它们并获得引用。
I also have this set ,我所掌握的唯一信息是 c = 4 并且想要找到 a 和 b。
我还想指出的是:
i)现在我没有代码可以在这里发布,因为我不知道如何编写一些东西来解决我的问题。但在阅读了你们可以为我提供的任何答案或帮助后,我很乐意编辑和更新问题。
ii) 我首先寻找一个我不知道 a 和 b 的解决方案。但如果这太难了,我会很高兴看到一些解决方案,我认为 a 或 b 是已知的。
编辑1:我想引用this question对于任何对这个问题感兴趣的人,因为这是对这里面临的问题的平行但也是重要的讨论
最佳答案
我会使用纯数值方法,即使您无法直接求解积分,也可以使用该方法。这是仅适合 a 参数的片段:
import numpy as np
from scipy.optimize import curve_fit
import pandas as pd
import matplotlib.pyplot as plt

def integrand(x, a):
    b = 1
    c = 3
    return 1/(a*np.sqrt(b*(1+x)**3 + c*(1+x)**4))

def integral(x, a):
    dx = 0.001
    xx = np.arange(0, x, dx)
    arr = integrand(xx, a)
    return np.trapz(arr, dx=dx, axis=-1)

vec_integral = np.vectorize(integral)

df = pd.read_csv('data-with-known-coef-a2-b1-c3.csv')
x = df.domin.values
y = df.resultados2.values
out_mean, out_var = curve_fit(vec_integral, x, y, p0=[2])

plt.plot(x, y)
plt.plot(x, vec_integral(x, out_mean[0]))
plt.title(f'a = {out_mean[0]:.3f} +- {np.sqrt(out_var[0][0]):.3f}')
plt.show()

vec_integral = np.vectorize(integral)
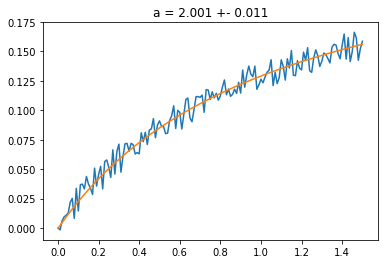
当然,您可以降低dx的值来获得所需的精度。当仅拟合 a 时,当您尝试拟合 b 时,拟合不会正确收敛(在我看来,因为 a 和b 强相关)。这是您得到的:
def integrand(x, a, b):
    c = 3
    return 1/(a*np.sqrt(np.abs(b*(1+x)**3 + c*(1+x)**4)))

def integral(x, a, b):
    dx = 0.001
    xx = np.arange(0, x, dx)
    arr = integrand(xx, a, b)
    return np.trapz(arr, dx=dx, axis=-1)

vec_integral = np.vectorize(integral)

out_mean, out_var = sp.optimize.curve_fit(vec_integral, x, y, p0=[2,3])
plt.title(f'a = {out_mean[0]:.3f} +- {np.sqrt(out_var[0][0]):.3f}\nb = {out_mean[1]:.3f} +- {np.sqrt(out_var[1][1]):.3f}')

plt.plot(x, y, alpha=0.4)
plt.plot(x, vec_integral(x, out_mean[0], out_mean[1]), color='green', label='fitted solution')
plt.plot(x, vec_integral(x, 2, 1),'--', color='red', label='theoretical solution')
plt.legend()
plt.show()
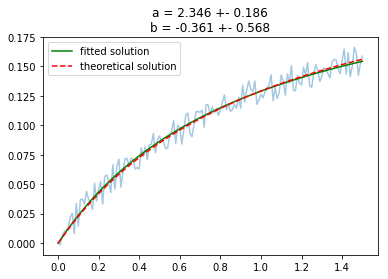
正如您所看到的,即使拟合得到的 a 和 b 参数“不好”,绘图也非常相似。
关于python - 使用 python(或其他有用的语言)在积分内拟合参数,我们在Stack Overflow上找到一个类似的问题: https://stackoverflow.com/questions/59724077/