我想在图表js圆环图中添加华氏度符号,目前,我的半圆环图如下所示:
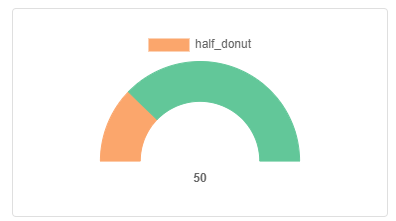
我想在“50”后面添加华氏符号,我该怎么做?
这是我的代码:
var chartColors = {
    hf_data : '#fba66c',
    themecolor:  '#62c799'
};

var hf_data = 12;
var myChart = new Chart('hf_data ', {
    type: 'doughnut',
    data: {
      labels: ['hf_data '],
      datasets: [{
        label: 'Temperature',
        data: [hf_data , hf_data +25],
        backgroundColor: [chartColors.hf_data , chartColors.themecolor],
        borderColor: [chartColors.hf_data , chartColors.themecolor],
        borderWidth: 1
      }]
    },
    options: {
        responsive:true,
        circumference: Math.PI,
        rotation:Math.PI,
        cutoutPercentage:60,
            title: {
            display: true,
            text: '50' ,
            position: 'bottom',
            verticalAlign: 'middle',
            align: 'center',
            y: 20,
        },
        legend: {
            position: 'top'
        },
        tooltips: {
            enabled: false
        },
        animation: {
            animateScale: true,
            animateRotate: true
        },
    }
});
最佳答案
您是否尝试直接添加到符号°F
text: '50°F'
如果不起作用,请使用 Unicode 十六进制数字
关于javascript - 如何在图表js圆环图中添加华氏度符号,我们在Stack Overflow上找到一个类似的问题: https://stackoverflow.com/questions/59834481/