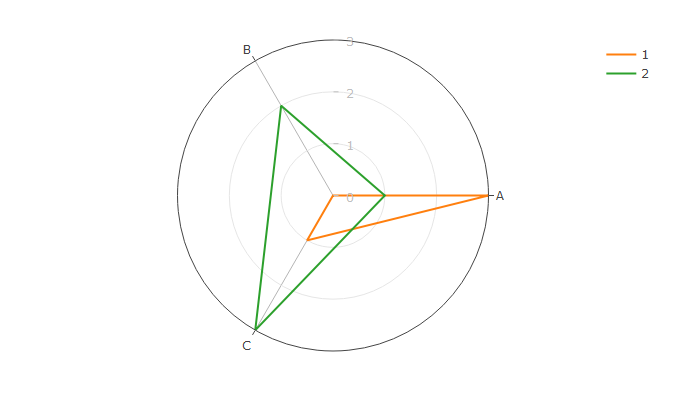
我正在用 plotly 在 R 中创建一个极坐标图,但我不希望线条之间的值用颜色填充。我找到了 line_close python 库的属性,但我在 R 中找不到等效项。
图表代码:
library(plotly)

p <- plot_ly(
  type = 'scatterpolar',
  mode = 'lines',
) %>%
  add_trace(
    mode = 'lines',
    r = c(3, 0, 1),
    theta = c('A','B','C'),
    name = '1'
  ) %>%
  add_trace(
    mode = 'lines',
    r = c(1, 2, 3),
    theta = c('A','B','C'),
    name = '2'
  ) %>%
  layout(
    polar = list(
      radialaxis = list(
        angle = 90,
        visible = T,
        range = c(0,3),
        showline = F,
        color = '#bfbfbf',
        nticks = 4,
        tickangle = 90
      )
    )
  )

p
图表图像:

最佳答案
我已经仔细浏览了 plotly::schema ,并且似乎没有选项可以内置于 plotly 的 R 端口中。 .
然而 , 定义自己的 add_closed_trace 很简单像这样的功能:
add_closed_trace <- function(p, r, theta, ...)
{
  plotly::add_trace(p, r = c(r, r[1]), theta = c(theta, theta[1]), ...)
}
您可以将其用作
add_trace 的插件。 , 像这样:library(plotly)
p <- plot_ly(
type = 'scatterpolar',
mode = 'lines',
) %>%
add_closed_trace(
mode = 'lines',
r = c(3, 0, 1),
theta = c('A','B','C'),
name = '1'
) %>%
add_closed_trace(
mode = 'lines',
r = c(1, 2, 3),
theta = c('A','B','C'),
name = '2'
) %>%
layout(
polar = list(
radialaxis = list(
angle = 90,
visible = T,
range = c(0,3),
showline = F,
color = '#bfbfbf',
nticks = 4,
tickangle = 90
)
)
)
p
关于R plotly : How to connect lines on polar/radar chart?,我们在Stack Overflow上找到一个类似的问题: https://stackoverflow.com/questions/60018891/