我正在尝试使用已知参数模拟突变数据,以进一步使用它来测试回归函数。在此模拟中,我希望突变计数取决于变量:
突变 ~ 拦截 + beta_cancer + beta_gene + beta_int + offset(log(ntAtRisk)))
其中偏移参数是理论上可以发生的最大计数数。
创建带参数的表
ncancers <- 20
ngenes <- 20

beta <- CJ(cancer = as.factor(0:ncancers), gene =  as.factor(0:ngenes))
beta[, beta_cancer := rnorm(n = (ncancers+1), sd = 1)[cancer]]
beta[, beta_gene := rnorm(n = (ngenes+1), sd = 1)[gene]]
beta[, beta_int := rnorm(n = (ngenes+1)*(ncancers+1), sd = 1.5)]
beta[, ntAtRisk := abs(round(rnorm(n = (ngenes+1)*(ncancers+1), mean = 5000, sd  = 2000), digits = 0))[gene]]
beta[, intercept := rnorm(n = (ngenes+1)*(ncancers+1), mean = 2, sd = 1)[gene]]

beta[cancer == "0", c("beta_cancer", "beta_int") := 0] # reference cancer type
beta[gene == "0", c("beta_gene", "beta_int") := 0] # reference gene
模拟突变计数
beta[, mu := exp(intercept + beta_cancer + beta_gene + beta_int + log(ntAtRisk))]
setkey(beta, cancer, gene)

dat <- beta
setkey(dat, cancer, gene)
dat[, mutations := rnbinom(n = nrow(dat), mu = mu, size = 1.5)]
dat[, mutations2 := MASS::rnegbin(n = nrow(dat),
                                  mu = exp(intercept + beta_cancer + beta_gene +
                                           beta_int + offset(log(ntAtRisk))),
                                  theta = 1.5)]
mutations 和 mutations2 使用不同的函数进行,其中 offset 变量要么作为普通变量包含在内,要么在第二种情况下指定作为偏移量。
然而,我正在做的测试没有通过其中任何一个。
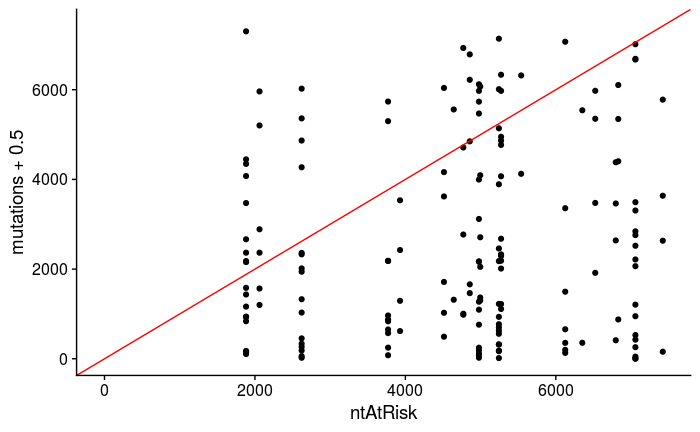
我需要突变计数不大于 ntAtRisk,但不幸的是,事实并非如此。我在互联网上找不到如何将偏移量包含到模拟中。我有什么选择?
ggplot(dat, aes(ntAtRisk, mutations+0.5)) +
  geom_point() +
  xlim(0, max(dat$ntAtRisk)) +
  ylim(0, max(dat$ntAtRisk)) +
  geom_abline(color = "red")
最佳答案
当您为具有偏移量的 poisson、negbin 拟合 glm 时,系数和截距之和不能大于 1,因为从 log(response) 中减去 log(offset) 并且它始终 < 1,对于示例:
n=seq(100,1000,by=100)
mu = n/5
y = rnbinom(n = 10,size =1.5,mu=mu)
glm.nb(y~1+offset(log(n)))

Call:  glm.nb(formula = y ~ 1 + offset(log(n)), init.theta = 1.217692649,
    link = log)

Coefficients:
(Intercept)
     -1.424
由于限制,设置这是一个非常棘手的模拟,在您的情况下,我建议将截距设置为非常低的值,因为最有可能的突变(如果我正确的话)无论如何都不会那么频繁:
set.seed(222)
beta <- CJ(cancer = as.factor(0:ncancers), gene =  as.factor(0:ngenes))
beta[, beta_cancer := rnorm(n = (ncancers+1))[cancer]]
beta[, beta_gene := rnorm(n = (ngenes+1))[gene]]
beta[, beta_int := rnorm(n = (ngenes+1)*(ncancers+1))]
beta[, ntAtRisk := abs(round(rnorm(n = (ngenes+1)*(ncancers+1), mean = 5000, sd  = 2000), digits = 0))[gene]]
beta[, intercept := runif(n = (ngenes+1)*(ncancers+1),min=-5,max=-3)[gene]]
beta[cancer == "0", c("beta_cancer", "beta_int") := 0] # reference cancer type
beta[gene == "0", c("beta_gene", "beta_int") := 0] # reference gene
在此阶段,您将通过添加对数项来计算偏移量,稍后无需再次添加偏移量:
beta[, mu := exp(intercept + beta_cancer + beta_gene + beta_int + log(ntAtRisk))]
setkey(beta, cancer, gene)
现在我们模拟数据,提供平均值 mu 并指定一个常数 theta 值:
dat <- beta
setkey(dat, cancer, gene)
dat[, mutations := rnbinom(n = nrow(dat), mu = mu, size = 1.5)]

ggplot(dat, aes(ntAtRisk, mutations+0.5)) +
  geom_point() +
  xlim(0, max(dat$ntAtRisk)) +
  ylim(0, max(dat$ntAtRisk)) +
  geom_abline(color = "red")

在此示例中,您可以看到,由于分散,某些计数 > n。您要么编写代码来手动纠正此问题,要么我猜您需要真正检查数据(如果您的预测确实如此高)。
关于r - 使用偏移变量模拟负二项式分布,我们在Stack Overflow上找到一个类似的问题: https://stackoverflow.com/questions/60641010/