我正在研究uber dataset 。我希望 map 完全适合屏幕。这就是我的代码目前的样子:
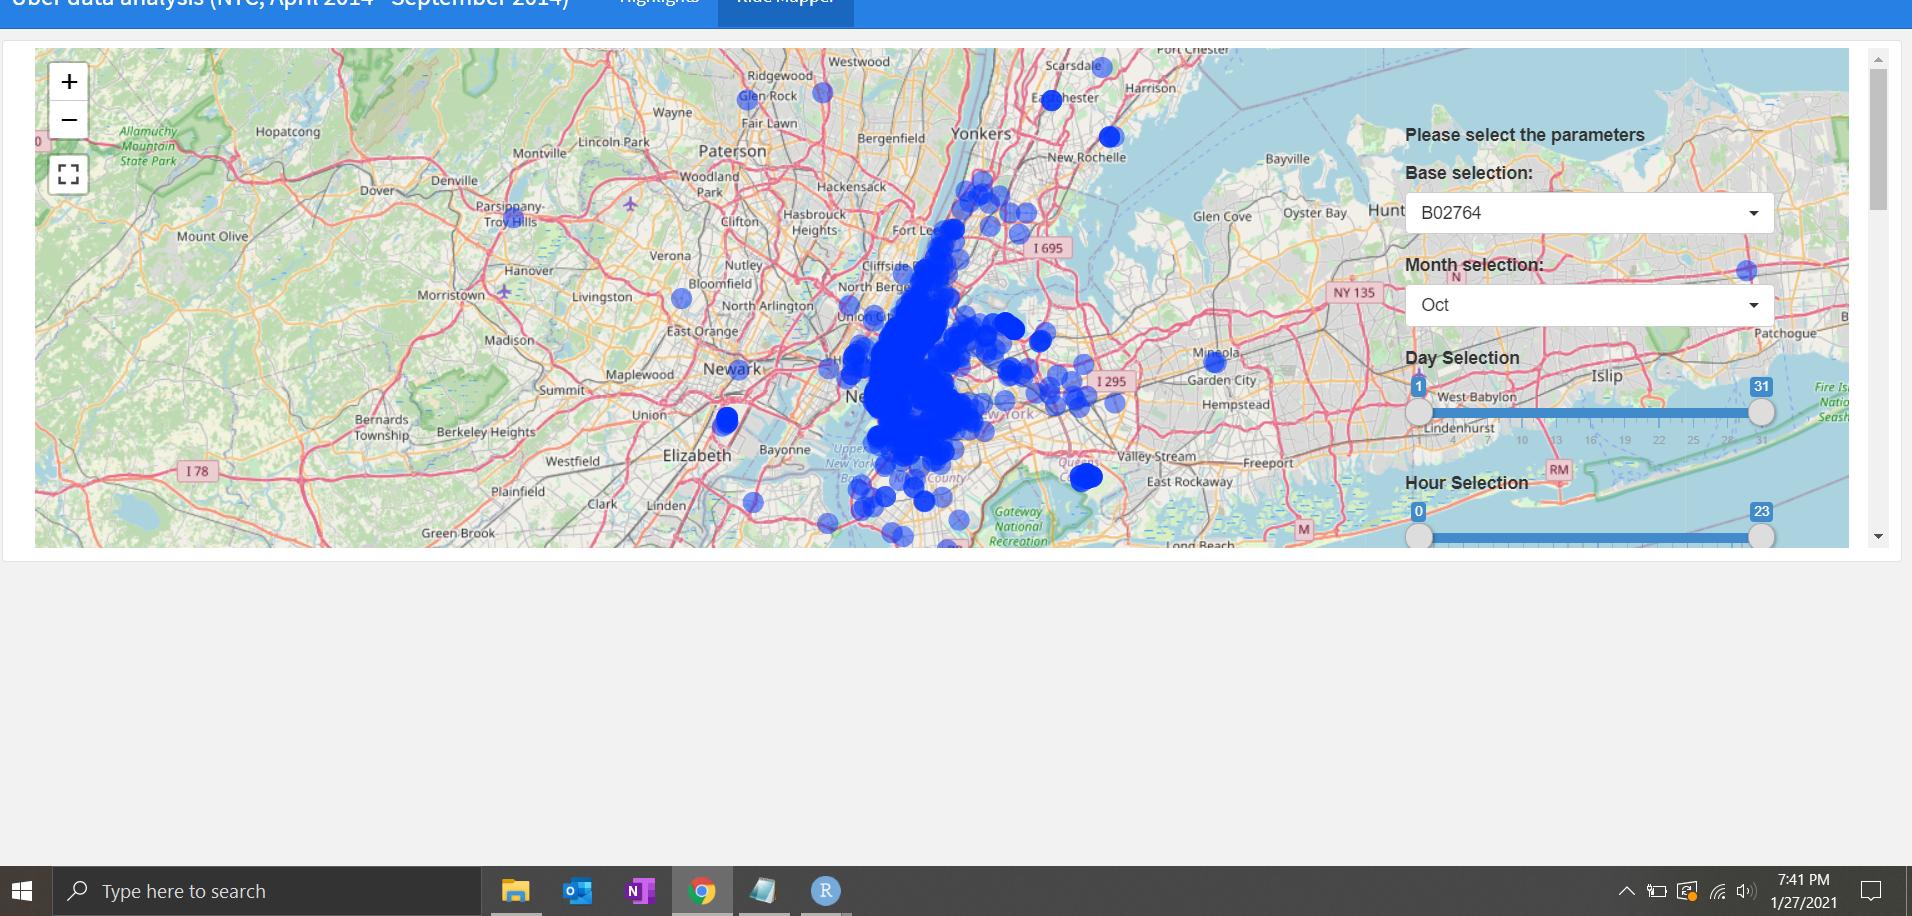
问题是,如果您启用垂直布局:滚动,则传单会产生问题。
title: "random"
output:
  flexdashboard::flex_dashboard:
    orientation: rows
    vertical_layout: scroll
runtime: shiny

shinyApp(
    fluidPage(
        leafletOutput(outputId = "df_map",height = 1300),
        absolutePanel(
            draggable = TRUE, top = "15%", left = "auto", right = "5%", class = "card",bottom = "auto",
            width = '20%', height = 'auto', fixed = TRUE,
            p(strong("Please select the parameters")),
            pickerInput(inputId = "BaseInput", label = "Base selection:", choices = unique(yr_2014$Base),
                             multiple = F,options = list(`actions-box` = TRUE), selected =unique(yr_2014$Base) ),
            pickerInput(inputId = "MonthInput", label = "Month selection:", choices = unique(yr_2014$month),
                             multiple = F,options = list(`actions-box` = TRUE), selected = unique(yr_2014$month)),
            sliderInput(inputId = "DayInput", "Day Selection", min=1, max=31,
                value=c(1, 31), sep=""),
            sliderInput(inputId = "HourInput", "Hour Selection", min=0, max=23,
                value=c(0, 23), sep="")

        )
    ),
    server = function(input, output, session) {

      df_maps <- reactive({
  yr_2014 %>%
    dplyr::filter(Base %in% input$BaseInput,month %in% input$MonthInput, day >= input$DayInput[1],
                   day <= input$DayInput[2], hour>=input$HourInput[1],hour<=input$HourInput[2])
       })

        output$df_map <- renderLeaflet({
        leaflet() %>%
            addTiles() %>%
            addFullscreenControl(pseudoFullscreen   =F) %>%
            addCircles(data = df_maps(), lng = ~Lon, lat = ~Lat, weight = 15, radius = 15)
        })
    }
)
请告诉我如何解决
最佳答案
您可以根据您的选择调整leafletOutput中的高度和宽度。
leafletOutput(outputId = "df_map",height = 800, width = 1000),
完整代码:
library(shiny)
library(leaflet.extras)
library(shinyWidgets)

shinyApp(
  fluidPage(
    leafletOutput(outputId = "df_map",height = 800, width = 1000),
    absolutePanel(
      draggable = TRUE, top = "15%", left = "auto", right = "5%", class = "card",bottom = "auto",
      width = '20%', height = 'auto', fixed = TRUE,
      p(strong("Please select the parameters")),
      pickerInput(inputId = "BaseInput", label = "Base selection:", choices = unique(yr_2014$Base),
                  multiple = F,options = list(`actions-box` = TRUE), selected =unique(yr_2014$Base) ),
      pickerInput(inputId = "MonthInput", label = "Month selection:", choices = unique(yr_2014$month),
                  multiple = F,options = list(`actions-box` = TRUE), selected = unique(yr_2014$month)),
      sliderInput(inputId = "DayInput", "Day Selection", min=1, max=31,
                  value=c(1, 31), sep=""),
      sliderInput(inputId = "HourInput", "Hour Selection", min=0, max=23,
                  value=c(0, 23), sep="")

    )
  ),
  server = function(input, output, session) {

    df_maps <- reactive({
      yr_2014 %>%
        dplyr::filter(Base %in% input$BaseInput,month %in% input$MonthInput, day >= input$DayInput[1],
                      day <= input$DayInput[2], hour>=input$HourInput[1],hour<=input$HourInput[2])
    })

    output$df_map <- renderLeaflet({
      leaflet() %>%
        addTiles() %>%
        addFullscreenControl(pseudoFullscreen   =F) %>%
        addCircles(data = df_maps(), lng = ~Lon, lat = ~Lat, weight = 15, radius = 15)
    })
  }
)

关于r - Flexdashboard - 传单未全屏,我们在Stack Overflow上找到一个类似的问题: https://stackoverflow.com/questions/65929992/