我希望我的轴的顺序为 ['好或更好'、'一般'、'差'、'非常差'] 有没有办法在不改变我当前代码太多的情况下做到这一点?
data.groupby('PAVEMENT CONDITIONS')['FISCAL YEAR'].value_counts().unstack().plot.bar()
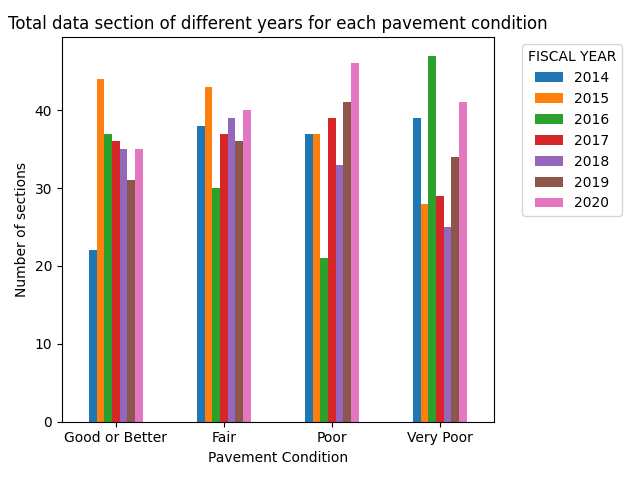
plt.title("Total data section of different years for each pavement condition")
plt.xlabel('Pavement Condition')
plt.ylabel('Number of sections')
plt.xticks(rotation=0)
plt.show()

最佳答案
最简单的方法是使用 reindex :
ax = (
    data.groupby('PAVEMENT CONDITIONS')['FISCAL YEAR']
        .value_counts()
        .unstack()
        .reindex(['Good or Better', 'Fair', 'Poor', 'Very Poor'])  # Specify order here
        .plot.bar()
)
或者创建一个 CategoricalDType 并排序为 Categorical Data :
# Establish Categories and order
cat_type = pd.CategoricalDtype(
    categories=['Good or Better', 'Fair', 'Poor', 'Very Poor'],
    ordered=True
)

# Change Type of PAVEMENT CONDITIONS to specified Categorical Type
data['PAVEMENT CONDITIONS'] = data['PAVEMENT CONDITIONS'].astype(cat_type)
ax = (
    data.groupby('PAVEMENT CONDITIONS')['FISCAL YEAR']
        .value_counts()
        .unstack()  # Uses categorical ordering
        .plot.bar()
)
两者都产生:
plt.title("Total data section of different years for each pavement condition")
plt.xlabel('Pavement Condition')
plt.ylabel('Number of sections')
plt.xticks(rotation=0)
plt.legend(title='FISCAL YEAR', bbox_to_anchor=(1.05, 1), loc='upper left')
plt.tight_layout()
plt.show()
使用的示例数据:
np.random.seed(5)
data = pd.DataFrame({
    'FISCAL YEAR': np.random.randint(2014, 2021, 1000),
    'PAVEMENT CONDITIONS': np.random.choice(
        ['Good or Better', 'Fair', 'Poor', 'Very Poor'], 1000)
})
data.head(10):
   FISCAL YEAR PAVEMENT CONDITIONS
0         2017           Very Poor
1         2020                Fair
2         2019                Fair
3         2020      Good or Better
4         2020                Poor
5         2014                Fair
6         2015                Poor
7         2014                Poor
8         2018                Poor
9         2020                Fair
关于python - 在Python中对分组条形图按一定顺序对x轴进行排序,我们在Stack Overflow上找到一个类似的问题: https://stackoverflow.com/questions/68091688/