我正在寻找一个简单的时间线图表,我可以在不同的时间跨度上显示多个事件。我没有在 Flex 中找到任何特定的图表,有人创建或使用过类似的东西吗?我发现了这个,Create a timeline from date to date in Flex/AS3 ,但这只是我正在寻找的部分内容。
最佳答案
我使用 mx:PlotChart 创建了时间线。它看起来像这样:
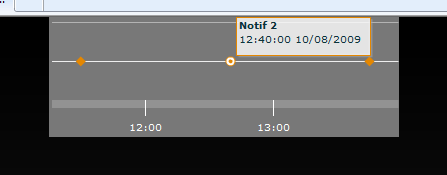
我使用了一个 PlotChart,底部有一个 DateTimeAxis,侧面有一个 LinearAxis。我将其放入一个小型 Flex 应用程序中:
<mx:Script>
    <![CDATA[
        import mx.charts.chartClasses.IAxis;
        import mx.charts.HitData;
        import mx.collections.ArrayCollection;

        [Bindable]
        public var max:Date;

        [Bindable]
        public var min:Date;

        [Bindable]
        private var notifAC:ArrayCollection;

        public function init():void
        {
            var notif1:Date = new Date(2009, 9, 8, 11, 30, 0, 0);
            var notif2:Date = new Date(2009, 9, 8, 12, 40, 0, 0);
            var notif3:Date = new Date(2009, 9, 8, 13, 45, 0, 0);

            notifAC = new ArrayCollection( [
                { Date: notif1, Name: "Notif 1", Value: 1 },
                { Date: notif2, Name: "Notif 2", Value: 1 },
                { Date: notif3, Name: "Notif 3", Value: 1 } ]);

            //set min and max to outside most notifs
            min = new Date(notif1.getTime());
            max = new Date(notif3.getTime());

            //calculate the range between min and max
            var timelineRange:Number = max.getTime() - min.getTime();

            //if less than 2 hours switch to minutes
            if(timelineRange < 7200000)
            {
                timelineDateAxis.dataUnits = "minutes";
            }
            //if greater than 2 days switch to days
            else if(timelineRange > 172800000)
            {
                timelineDateAxis.dataUnits = "days";
            }

            //as long as the timeline has a range other than 0, add 10% to the min and max
            if(timelineRange != 0)
            {
                min = new Date(min.getTime() - (timelineRange * .1));
                max = new Date(max.getTime() + (timelineRange * .1));
            }
            //if the timeline does have a range of 0, add 1 minute to min and max
            else
            {
                min = new Date(min.getTime() - 60000);
                max = new Date(max.getTime() + 60000);
            }
            //set the min and max of the axis
            timelineDateAxis.minimum = min;
            timelineDateAxis.maximum = max;
        }

        public function timelineDataTips(e:HitData):String
        {
            return "<b>" + e.item.Name + "</b>\n" + dataTipsFormatter.format(e.item.Date);
        }
    ]]>
</mx:Script>

<mx:Style>
    .issueTimelineHolder
    {
        background-color:#787878;
    }
    .issueTimelineChart
    {
        padding-top:5px;
        padding-right:0;
        padding-bottom:0;
        padding-left:0;
    }
    .timelineDateAxis
    {
        color:#ffffff;
    }

</mx:Style>

<mx:Stroke id="timelineDateAxisStroke"
    color="#9B9B9B"
    weight="8"
    alpha=".75"
    caps="none"
/>
<mx:Stroke id="timelineTickStroke"
    color="#ffffff"
/>

<mx:DateFormatter id="dataTipsFormatter" formatString="HH:NN:SS MM/DD/YYYY" />

 <mx:Canvas styleName="issueTimelineHolder" width="350" height="120">
     <mx:PlotChart id="issueTimelineChart" styleName="issueTimelineChart" width="100%" height="100%"
        showDataTips="true" dataTipFunction="timelineDataTips" dataProvider="{notifAC}">
        <mx:backgroundElements>
            <mx:GridLines direction="horizontal" />
        </mx:backgroundElements>

        <mx:verticalAxis>
            <mx:LinearAxis id="timelineValueAxis" minimum="0" maximum="2" interval="1" />
        </mx:verticalAxis>
        <mx:verticalAxisRenderers>
            <mx:AxisRenderer axis="{timelineValueAxis}" showLabels="false" showLine="false"
                tickPlacement="none" minorTickPlacement="none" />
        </mx:verticalAxisRenderers>

        <mx:horizontalAxis>
            <mx:DateTimeAxis id="timelineDateAxis" dataUnits="hours"
                minimum="{min}" maximum="{max}" displayLocalTime="true"/>
        </mx:horizontalAxis>
        <mx:horizontalAxisRenderers>
            <mx:AxisRenderer axis="{timelineDateAxis}" styleName="timelineDateAxis" tickPlacement="outside">
                <mx:axisStroke>{timelineDateAxisStroke}</mx:axisStroke>
                <mx:tickStroke>{timelineTickStroke}</mx:tickStroke>
            </mx:AxisRenderer>
        </mx:horizontalAxisRenderers>

        <mx:series>
            <mx:PlotSeries xField="Date" yField="Value" />
        </mx:series>
    </mx:PlotChart>
</mx:Canvas>
关于apache-flex - Flex 中包含事件的简单时间线图表,我们在Stack Overflow上找到一个类似的问题: https://stackoverflow.com/questions/1460439/