使用 Hough lines 检测图像中的线条后,如何使用它来计算引用图像线条的角度(旋转)变化?
最佳答案
读者注意事项:这是一个后续问题,请参阅以下内容了解背景:
- How to select maximum intensity in Hough transform in MATLAB?
- Calculating displacement moved in MATLAB
该过程与我之前展示的类似。下面我使用the images from your previous question (由于您只提供了一个,所以我通过将第一个旋转 10 度来创建另一个)。
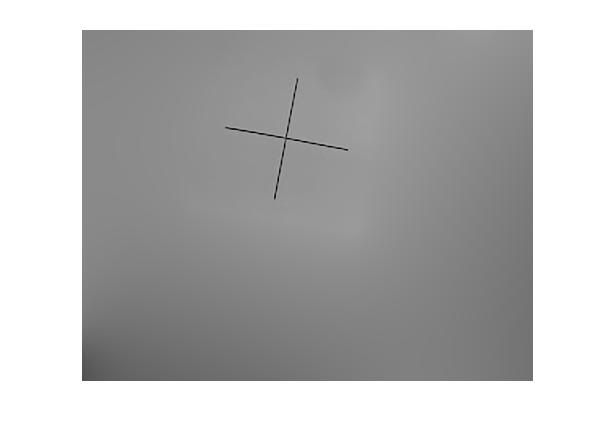
我们首先检测两个图像的线条。我们在Hough的帮助下做到了这一点transform functions 。应用于这两个图像的效果如下:

接下来,我们要使用线端点作为控制点来执行图像配准。首先,我们确保两个图像中的点相互对应。我通过使用 convhull 计算凸包来做到这一点 它会自动按逆时针顺序对它们进行排序(或者是相反的方向!)。上面显示的数字表示顺序。
最后,我们使用函数 cp2tform 获取变换矩阵,我们用它来对齐图像并提取平移、旋转和缩放。
完整代码如下:
%% # Step 1: read and prepare images
%# (since you provided only one, I created the other by rotating the first).
I1 = imread('/image/Se6zX.jpg');
I1 = rgb2gray( imcrop(I1, [85   35  445  345]) ); %# Get rid of white border
I2 = imrotate(I1, -10, 'bilinear', 'crop'); %# Create 2nd by rotating 10 degrees

%% # Step 2: detect the cross sign endpoints (sorted in same order)
p1 = getCross(I1);
p2 = getCross(I2);

%% # Step 3: perform Image Registration
%# Find transformation that maps I2 to I1 using the 4 control points for each
t = cp2tform(p2,p1,'affine');

%# Transform I2 to be aligned with I1
II2 = imtransform(I2, t, 'XData',[1 size(I1,2)], 'YData',[1 size(I1,1)]);

%# Plot
figure('menu','none')
subplot(131), imshow(I1), title('I1')
subplot(132), imshow(I2), title('I2')
subplot(133), imshow(II2), title('I2 (aligned)')

%# Recover affine transformation params (translation, rotation, scale)
ss = t.tdata.Tinv(2,1);
sc = t.tdata.Tinv(1,1);
tx = t.tdata.Tinv(3,1);
ty = t.tdata.Tinv(3,2);
scale = sqrt(ss*ss + sc*sc)
rotation = atan2(ss,sc)*180/pi
translation = [tx ty]
这是提取线条端点的函数:
function points = getCross(I)
    %# Get edges (simply by thresholding)
    I = imfilter(I, fspecial('gaussian', [7 7], 1), 'symmetric');
    BW = imclearborder(~im2bw(I, 0.5));

    %# Hough transform
    [H,T,R] = hough(BW);

    %# Detect peaks
    P  = houghpeaks(H, 2);

    %# Detect lines
    lines = houghlines(BW, T, R, P);

    %# Sort 2D points in counterclockwise order
    points = [vertcat(lines.point1); vertcat(lines.point2)];
    idx = convhull(points(:,1), points(:,2));
    points = points(idx(1:end-1),:);
end
结果:

scale =
    1.0025
rotation =
   -9.7041
translation =
   32.5270  -38.5021
旋转恢复为几乎 10 度(存在一些不可避免的误差),并且缩放实际上为 1(意味着没有缩放)。请注意,上面的示例中有一个平移组件,因为没有围绕十字标志的中心执行旋转。
关于matlab - MATLAB 中的粗糙线,我们在Stack Overflow上找到一个类似的问题: https://stackoverflow.com/questions/2062826/