我有按三个变量交叉分类的数据,类似这样...
library(tidyverse)

d0 <- mtcars %>%
  group_by(cyl, am, vs) %>%
  summarise(ave_wt = mean(wt)) %>%
  ungroup() %>%
  complete(cyl, am, vs) %>%
  replace_na(list(ave_wt = 0)) %>%
  mutate_if(names(.) %in% names(.)[1:3], as.factor)
d0
# # A tibble: 12 x 4
#       cyl     am     vs   ave_wt
#    <fctr> <fctr> <fctr>    <dbl>
#  1      4      0      0 0.000000
#  2      4      0      1 2.935000
#  3      4      1      0 2.140000
#  4      4      1      1 2.028286
#  5      6      0      0 0.000000
#  6      6      0      1 3.388750
#  7      6      1      0 2.755000
#  8      6      1      1 0.000000
#  9      8      0      0 4.104083
# 10      8      0      1 0.000000
# 11      8      1      0 3.370000
# 12      8      1      1 0.000000
我正试图用这些点来绘制...
ggplot(data = d0,
       mapping = aes(x = am, y = ave_wt, colour = vs, group = cyl)) +
 geom_point(position = position_dodge(0.5))
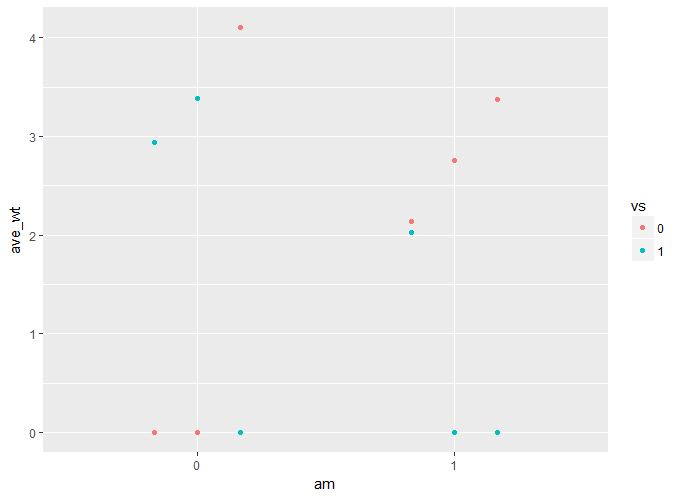
... 加入每个 vs - am 组合,如下所示,但线条更直(此处未使用 ggplot 绘制线条)。

到目前为止我所有的尝试都没有奏效......
ggplot(data = d0,
       mapping = aes(x = am, y = ave_wt, colour = vs, group = cyl)) +
 geom_point(position = position_dodge(0.5)) +
 geom_line()
 # geom_line(mapping = aes(group = interaction(vs, am)))
 # geom_line(mapping = aes(group = interaction(vs, am)),
 #           position = position_dodge(0.5))
 # geom_line(position = position_dodge(0.5))
 # geom_path(position = position_dodge(0.5),
 #           mapping = aes(group = interaction(vs, am)))
最佳答案
这是适合您的一种方法。这个想法是根据您的输出创建最终输出。我使用了您图形后面的数据框。它包含我们需要的所有信息。我对数据进行了排序并将数据点分为四组,这是在 mutate() 中完成的。然后,我画了下图。
library(dplyr)
library(ggplot2)

foo <- ggplot(data = d0,
              aes(x = am, y = ave_wt, colour = vs, group = cyl)) +
       geom_point(position = position_dodge(0.5))

temp <- as.data.frame(ggplot_build(foo)$data[1])

arrange(temp, colour, x) %>%
mutate(whatever = rep(1:4, each = 3)) %>%
ggplot(aes(x = x, y = y, color = factor(colour, levels = c("#F8766D", "#00BFC4")),
       group = whatever)) +
geom_line() +
geom_point() +
scale_x_continuous(breaks = c(1,2), minor_breaks = NULL, labels = c(0, 1)) +
labs(x = "am", y = "ave_wt") +
scale_color_discrete(name = "vs", labels = c(0, 1))

关于r - 从 geom_point 连接 position_dodge 点,我们在Stack Overflow上找到一个类似的问题: https://stackoverflow.com/questions/49830313/