我想用 R 绘制一个时间线,其中的时间段很容易识别,我可以在其中个性化可视化:
我使用时间轴库,但是我找不到如何对其进行个性化。任何建议或其他图书馆?
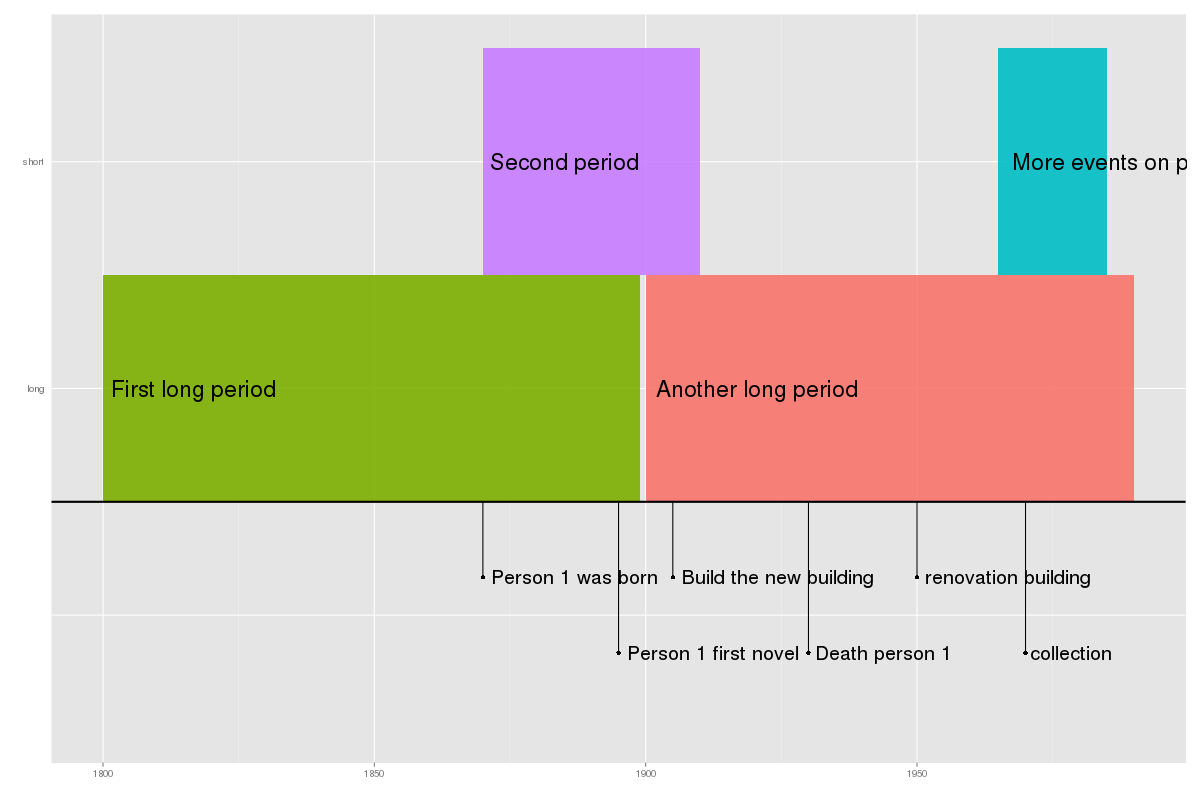
输出如下所示:
我的 R 代码是这样的:
require(timeline)
f <- "~/Documents/periods.csv"
crono <- read.delim(f, header=TRUE)
f <- "~/Documents/events.csv"
events <- read.delim(f, header=TRUE)
draw <- function() {
   timeline(crono, events,
     text.size = 8,
     text.color = "black",
     num.label.steps = 2,
     event.label.method = 1,
     event.text.size = 7,
     event.label = '',
     event.line = TRUE,
     event.above = FALSE)
     }

png("~/Documents/Timeline.png", width = 1200,
      height = 800, units = "px", bg = "transparent", res = NA)
draw()
dev.off()
这是我的数据。一系列时间段:
Name                        Group   Start_year  End_year
First long period            long         1800      1899
Second period               short         1870      1910
Another long period          long         1900      1990
More events on period time  short         1965      1985
以及同时发生的一些事件:
Event                   year
Person 1 was born       1870
Person 1 first novel    1895
Build the new building  1905
Death person 1          1930
renovation building     1950
collection              1970
最佳答案
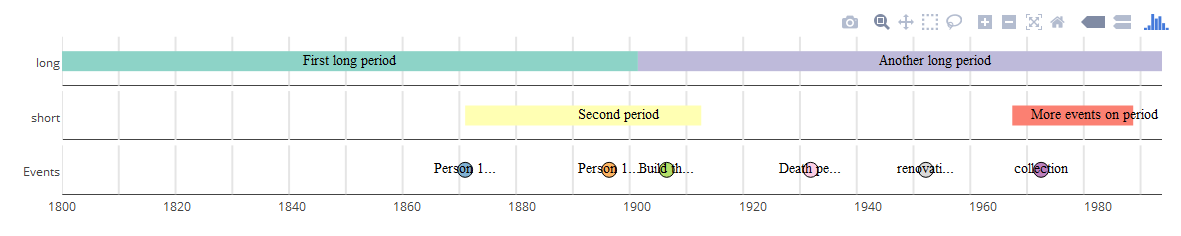
使用包 vistime ,您可以个性化框的颜色(如果您在数据框中添加“颜色”列或告诉 vistime 与 col.colors ='yourColourColumnName' ,您可以添加工具提示并分配到组( col.groups = )。
您可以生成 plotly-Timelines、highcharter-Timelines 或 ggplot2-Timelines,它们都是可个性化的。
install.packages("vistime")
library(vistime)
crono <- read.csv(text="Name,Group,start_year,end_year
                            First long period,long,1800-01-01,1899-12-31
                            Second period,short,1870-01-01,1910-12-31
                            Another long period,long,1900-01-01,1990-12-31
                            More events on period time,short,1965-01-01,1985-12-31")
events <- read.csv(text="Name,start_year
                            Person 1 was born,1870-01-01
                            Person 1 first novel,1895-01-01
                            Build the new building,1905-01-01
                            Death person 1,1930-01-01
                            renovation building,1950-01-01
                            collection,1970-01-01")
events$end_year <- NA
events$Group <- "Events"

# or gg_vistime, or hc_vistime
vistime(rbind(crono, events),
        col.start  = "start_year",
        col.end = "end_year",
        col.event = "Name",
        col.group = "Group")
更多关于个性化的信息:https://shosaco.github.io/vistime/
关于r - 如何使用 R 个性化时间线?,我们在Stack Overflow上找到一个类似的问题: https://stackoverflow.com/questions/32447483/