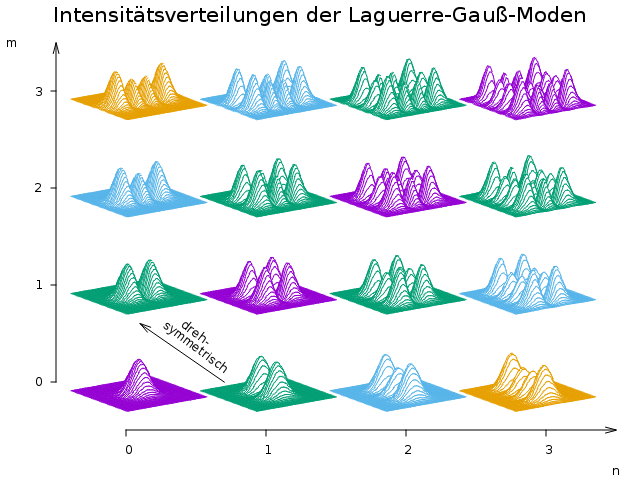
我尝试重现一幅图像,显示具有参数 m 和 n 的横向电磁 (TEM) 模式的强度分布。我使用了表面图的 4x4 多图矩阵。结果令我满意。只是为了完整性:
- 您将如何添加坐标轴而不是为每个单独的绘图设置单独的标题?
- 有没有办法像原始图像那样只在一个方向上显示表面上的等值线?
- 原作者省略了多图的下部以强调对称性。我不确定这是否真的说明了这一点。我应该只显示完整的矩阵还是你能想出更好的方法?

解决方案
谢谢大家。根据您的建议,我现在有以下图片:
Qt 终端输出以下代码:
m=n=3           # max. 3
THETA=2.5

set hidden3d trianglepattern 2
set isosamples 50
set xrange [-THETA:THETA]
set yrange [-THETA:THETA]
set view 70,55,,.5
unset border
unset key
unset tics

H0(x)=1
H1(x)=2*x
H2(x)=4*x**2-2
H3(x)=8*x**3-12*x

set multiplot layout n+1,m+1 upwards margins .14,.9,.14,.9 spacing .05 \
        title 'Intensitätsverteilungen der Laguerre-Gauß-Moden' font ",16"
do for [i=0:n] for [j=0:m] {
        eval sprintf("splot (H%d(sqrt(2)*y)*exp(-y**2))**2\
                          * (H%d(sqrt(2)*x)*exp(-x**2))**2\
                                with lines lc %d", i, j, abs(i-j)+1)
}
set origin 0,0
set size 1,1
unset margins
set title ' '
set arrow from 0,-.5 to graph 1,0
set arrow from -.5,0 to graph 0,1
set label at .5, .5 "dreh-\nsymmetrisch" center rotate by -37
set arrow from .7,0 to .1,.6
set tics out nomirror
set xtics 0, 1, n
set ytics 0, 1, m
set xrange [-.5:n+.5]
set yrange [-.5:m+.5]
set xlabel offset graph .5,0 "n"
set ylabel offset graph 0,.5 "m" norotate
plot NaN
unset multiplot
- 我没有手动添加轴,而是在上面绘制了一个适当缩放的二维图。因此,参数 m 和 n 的坐标轴比例不是 3。为了支持更高阶,必须根据 Hermite 多项式 Hn(x) 添加; n=1, 2, 3, ... 并且可能需要调整多图的边距。
- 事实证明,提供
set hidden3d trianglepattern 2是仅在一个方向上显示等值线的最简单方法。 - 颜色应有助于形成成对的旋转对称图形。人们可能会争论美学,但希望信息能够得到传达。
最佳答案
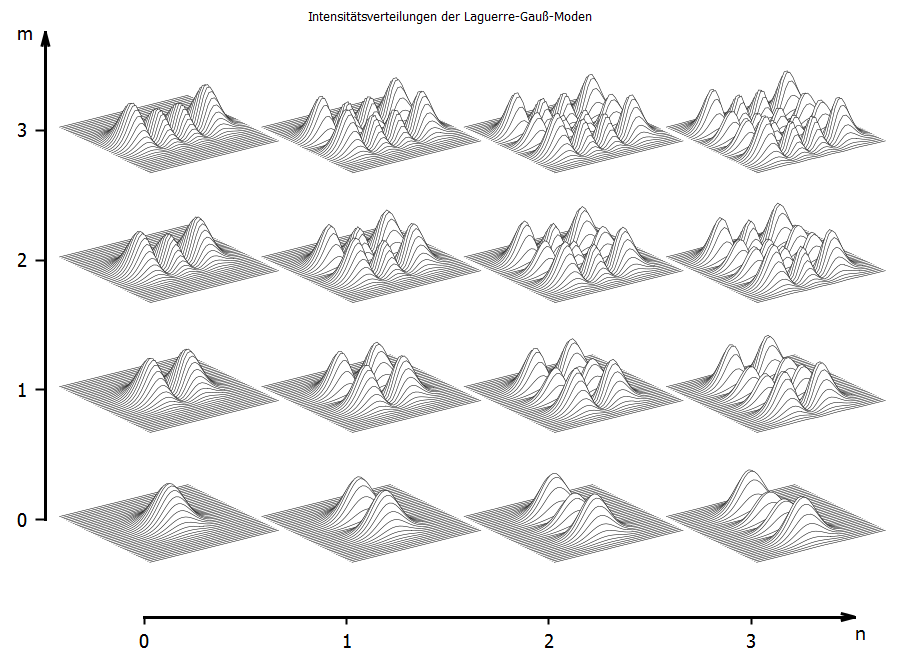
尝试以下操作并根据您的需要进行调整。当然还有改进的余地。
到 1. 为多图使用一些边距,并通过需要调整的箭头和标签绘制线条。
到 2. 将数据放入数据 block 并绘制 with zerrorfill(参见 help zerrorfill)
to 3. 我会说这是一个品味问题。为什么作者只展示TEM01,只有一个例子?为什么不全部显示?
代码:
### isolines only in one direction
reset session
# set term wxt size 900,950   # or some other terminal and sizes

unset key
unset tics
set border 0
set view 55,55,1.0,0.5

set style fill solid 0.0
do for [i=1:99] {
    set linetype i lw 0.5 lc rgb "black"
}

THETA=2.5
set xrange [-THETA:THETA]
set yrange [-THETA:THETA]

H0(x)=1
H1(x)=2*x
H2(x)=4*x**2-2
H3(x)=8*x**3-12*x

m=n=3
set multiplot layout n+1,m+1 upwards \
    title 'Intensitätsverteilungen der Laguerre-Gauß-Moden' \
    margins screen 0.1, screen 0.95, screen 0.15, screen 0.9

    do for [i=0:n] for [j=0:m] {
    #    if (i >= j || i == 0 && j == 1) {   # uncommenting this line skips TEM02,03,12,13,23
            # eval sprintf("set title 'TEM_{%d%d}'", i, j)    # uncomment to show title
             eval sprintf("f(x,y) = (H%d(sqrt(2)*y)*exp(-y**2))**2 \
                              * (H%d(sqrt(2)*x)*exp(-x**2))**2", i, j)
            # data to datablock
            set print $Data
                c=20.0
                do for [iii=-c:c] {
                    do for [jjj=-c:c] {
                        x=iii/c*THETA
                        y=jjj/c*THETA
                        print sprintf("%g %g %g",x,y,f(x,y))
                    }
                print ""  # add empty line
                print ""  # add empty line
                }
            set print
            splot $Data using 1:2:3:(0):3 with zerrorfill

    #    } else { set multiplot next }      # uncommenting this line skips TEM02,03,12,13,23

    }
    unset title

    # arrows and labels
    A1x0=0.16; A1x1=0.95; A1y=0.05;  A1grid=0.225
    A2x=0.05;  A2y0=0.20; A2y1=0.95; A2grid=0.20
    TicL=0.01
    set arrow 1 from screen A1x0,A1y to screen A1x1,A1y lw 3
    set label 1 "n" at screen A1x1,A1y offset 0,-1 font ",14"
    set arrow 2 from screen A2x,A2y0 to screen A2x,A2y1 lw 3
    set label 2 "m" at screen A2x,A2y1 offset -4,0 font ",14"
    do for [i=0:3] {
        set label i+3 sprintf("%d",i) at screen A1x0+i*A1grid,A1y offset -0.7,-1.5 font ",14"
        set arrow i+3 from screen A1x0+i*A1grid,A1y to screen A1x0+i*A1grid,A1y-TicL lw 2 nohead
        set label i+7 sprintf("%d",i) at screen A2x,A2y0+i*A2grid offset -4,0 font ",14"
        set arrow i+7 from screen A2x,A2y0+i*A2grid to screen A2x-TicL,A2y0+i*A2grid lw 2nohead
    }
    plot NaN   # plot nothing but to add the arrows and labels
unset multiplot
### end of code
结果:
关于Gnuplot 多图轴,一个方向的等值线,我们在Stack Overflow上找到一个类似的问题: https://stackoverflow.com/questions/61189690/