我想一次拟合多条曲线,并根据它们的 3 个估计参数——渐近线、斜率和 x0,对它们进行统计比较。
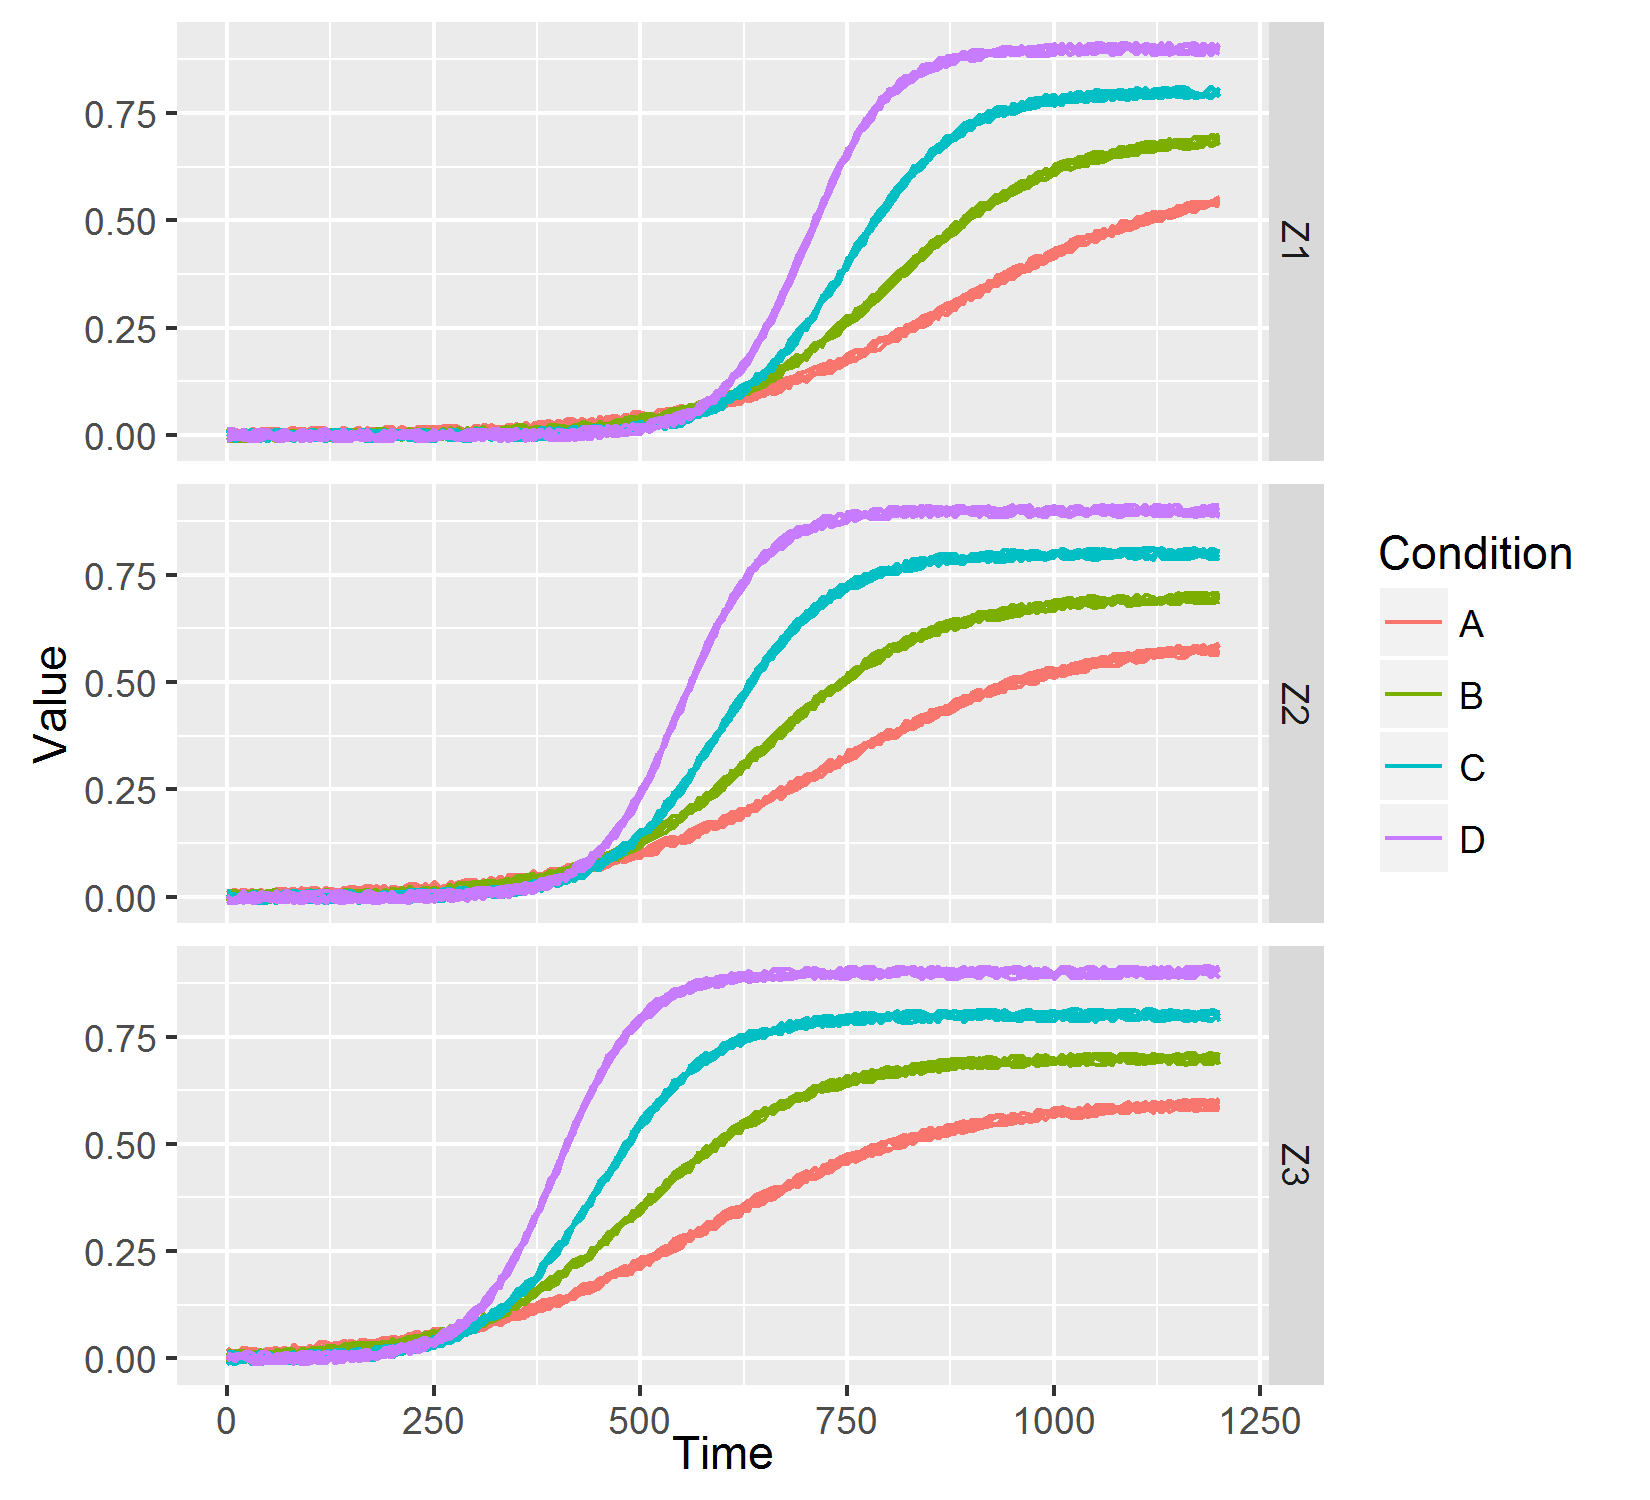
这是要建模的数据的理想化图像:
大多数可搜索页面都提供了适合单个曲线的方法,如下所示:
http://kyrcha.info/2012/07/08/tutorials-fitting-a-sigmoid-function-in-r/
和这里
http://rstudio-pubs-static.s3.amazonaws.com/7812_5327615eb0044cf29420b955ddaa6173.html
就我而言,我想测试(统计)改变变量水平对 sigmoid 的三个参数的影响 .也就是说,当我拟合这个模型时:
model <- nls(y ~ asym / (1 + exp( -slope * (x – x0) ) ), start = c(…), data = my_data)
我想添加互动两个因子(例如,“factorA”和“factorB”)与每个 asym、slope 和 x0 项,我们可以用
lm() 做的方式或 glm() ,如下所示:model_int <- nls(y ~ asym*factorA / (1 + exp( -(slope*factorA) * (x – (x0*factorA) ) ), start = c(…), data = my_data)
这样,我可以看到这三个参数在 factorA 的不同级别(以及可能有多个其他因素,如您从图像中看到的)在统计上是否不同。例如,我们可以看到“条件”对曲线的渐近线有影响。
我以前用 做过这件事虚拟编码 每个交互变量的每个级别,但这不是直接测试这些变量的方法,并且随着模型的发展相当冗长。它看起来像这样:
model_dummy <- nls(y ~ (asym+ asym.L1 * is.L1 + asym.l2*is.L2) /
(1 + exp( -slope * (x – (x0 + x0.L1 * is.L1 + x0.L2 * is.L2) ) ) ),
start = c(…), data = my_data)
正如您可能猜到的那样,这种方法在整洁和缺乏可解释性方面有明显的缺点。
有谁知道如何拟合一组 sigmoids,其中参数与数据集中的变量相互作用以产生形状略有不同的曲线?
最佳答案
好吧,我不确定这是否是您要查找的内容,但是来自 nls 的这个示例功能可以帮助您:
> head(muscle)
   Strip Conc Length
3    S01    1   15.8
4    S01    2   20.8
5    S01    3   22.6
6    S01    4   23.8
9    S02    1   20.6
10   S02    2   26.8
# get some initial values
musc.1 <- nls(Length ~ cbind(1, exp(-Conc/th)), muscle,
              start = list(th = 1), algorithm = "plinear")
summary(musc.1)

# and now with factor Strip
b <- coef(musc.1)
musc.2 <- nls(Length ~ a[Strip] + b[Strip]*exp(-Conc/th), muscle,
              start = list(a = rep(b[2], 21), b = rep(b[3], 21), th = b[1]))
summary(musc.2)
所以在你的情况下,它会是这样的:
fit <- nls(y ~ asym[Factor]/ (1 + exp(-slope[Factor]*(x –x0[Factor]))),
            start = c(…),
            data = my_data)
希望这可以帮助
关于r - 拟合和比较 R 中的多条 sigmoid 曲线,我们在Stack Overflow上找到一个类似的问题: https://stackoverflow.com/questions/42015299/