生成图形以保存到 pdf 文件时,我想调整图形相对于页面边缘的位置,例如沿所有边添加英寸边距。据我所知,执行此操作的解决方案(例如,在 this question 中):
constrained_layout模式 -- 申请 plt.subplots_adjust()在创建图形之后但在 fig.savefig() 之前弄乱了受约束的布局 bbox_inches="tight"或 pad=-1似乎没有做任何有意义的事情有没有一种直接的方法来调整受限布局图形的外部边距?
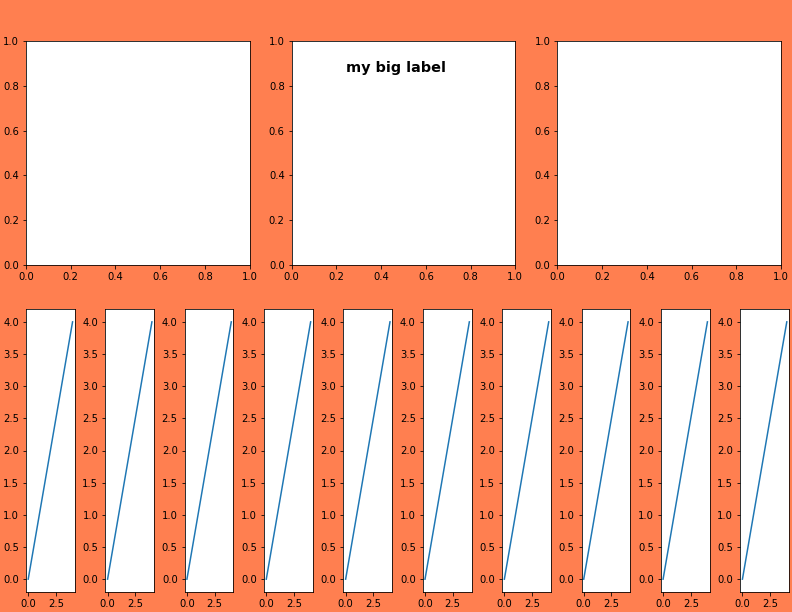
例如:
fig = plt.figure(constrained_layout=True, figsize=(11, 8.5))

page_grid = gridspec.GridSpec(nrows=2, ncols=1, figure=fig)

# this doesn't appear to do anything with constrained_layout=True
page_grid.update(left=0.2, right=0.8, bottom=0.2, top=0.8)

top_row_grid = gridspec.GridSpecFromSubplotSpec(1, 3, subplot_spec=page_grid[0])
for i in range(3):
    ax = fig.add_subplot(top_row_grid[:, i], aspect="equal")

n_bottom_row_plots = 10
qc_grid = gridspec.GridSpecFromSubplotSpec(1, n_bottom_row_plots, subplot_spec=page_grid[1])
for i, metric in enumerate(range(n_bottom_row_plots)):
    ax = fig.add_subplot(qc_grid[:, i])
    plt.plot(np.arange(5), np.arange(5))

fig.suptitle("my big label", fontweight="bold", fontsize="x-large", y=0.9)

# this ruins the constrained layout
# plt.subplots_adjust(left=0.2,right=0.8, bottom=0.2, top=0.8)

fig.savefig("temp.png", facecolor="coral")
最佳答案
您是否尝试过使用受约束的布局填充选项?
fig.set_constrained_layout_pads(w_pad=4./72., h_pad=4./72.,
            hspace=0./72., wspace=0./72.)
''' Here is the modified code '''

import matplotlib.pyplot as plt
import matplotlib.colors as mcolors
import matplotlib.gridspec as gridspec
import numpy as np


fig = plt.figure(constrained_layout=True, figsize=(11, 8.5))
fig.set_constrained_layout_pads(w_pad=2./12., h_pad=4./12.,
            hspace=0., wspace=0.)
page_grid = gridspec.GridSpec(nrows=2, ncols=1, figure=fig)

fig.suptitle("My BIG Label", fontweight="bold", fontsize="x-large", y=0.98)


# this doesn't appear to do anything with constrained_layout=True
page_grid.update(left=0.2, right=0.8, bottom=0.2, top=0.8)

top_row_grid = gridspec.GridSpecFromSubplotSpec(1, 3, subplot_spec=page_grid[0])
for i in range(3):
    ax = fig.add_subplot(top_row_grid[:, i], aspect="equal")

n_bottom_row_plots = 10
qc_grid = gridspec.GridSpecFromSubplotSpec(1, n_bottom_row_plots, subplot_spec=page_grid[1])
for i, metric in enumerate(range(n_bottom_row_plots)):
    ax = fig.add_subplot(qc_grid[:, i])
    plt.plot(np.arange(5), np.arange(5))


# this ruins the constrained layout
# plt.subplots_adjust(left=0.2,right=0.8, bottom=0.2, top=0.8)

fig.savefig("temp.png", facecolor="coral")
关于python - 添加具有约束布局的外部边距?,我们在Stack Overflow上找到一个类似的问题: https://stackoverflow.com/questions/63505647/