我在 markdown 文件中生成了一些图表,但图表在 html 文件中看起来不正确。
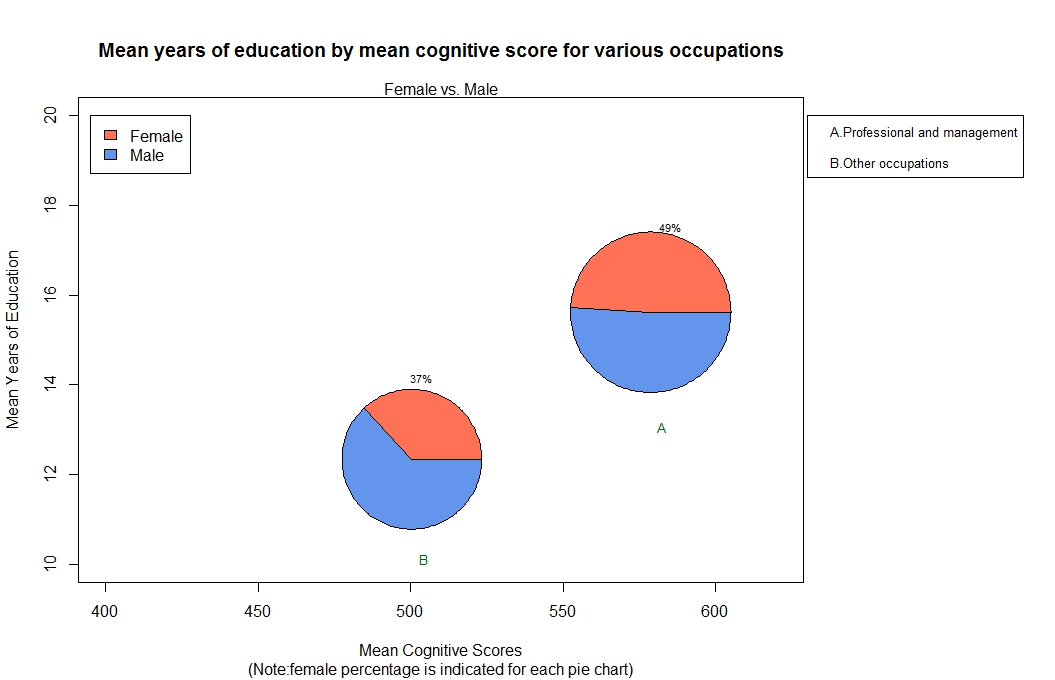
在 RStudio 中,它运行良好,如下所示:
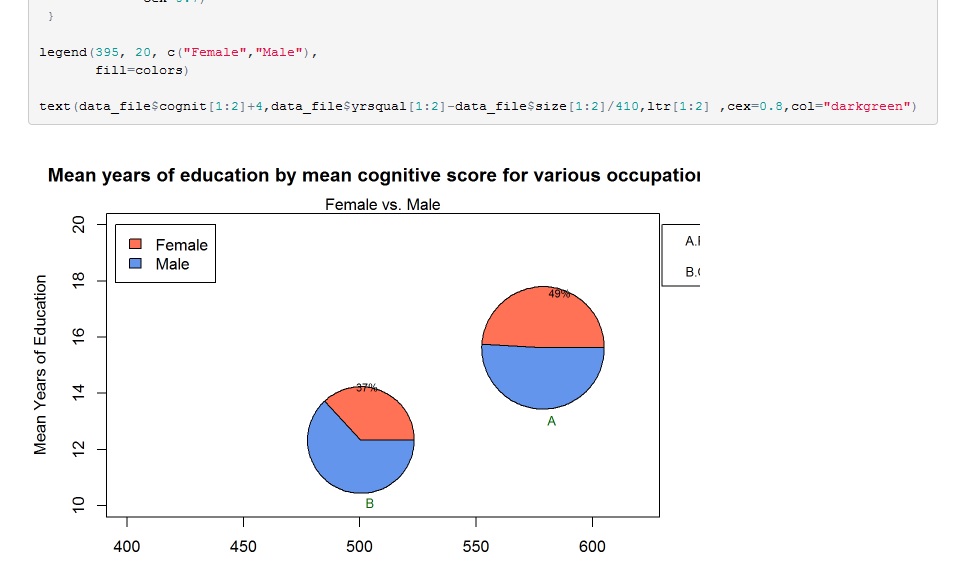
但是在markdown html文件中,右侧的图例框被截断了:
我试过调整 fig.width , fig.align , fig.show='asis' , fig.crop .他们要么没有做任何改变,要么只是让整个图形看起来更窄,图例框仍然不完整。
有没有办法让它在markdown html文件中看起来正常?
最佳答案
我在 Rmarkdown html 报告中也有这个问题,我通过更改 ggplot2 中的图边距解决了它:theme(plot.margin=unit(c(1,2,1,1),"cm"))。第二个“单位”数字从 1 增加到 2 以允许右侧的图例。我在这里找到了这个答案:ggplot2: Exclude legend from aspect ratio
关于html - R Markdown 图图例被切断,我们在Stack Overflow上找到一个类似的问题: https://stackoverflow.com/questions/35073636/