我正在使用 puppeteer 的 page.metrics() 调用 DevTools 协议(protocol) Performance.getMetrics()
这是返回数据的示例:
{
   Timestamp: 672.244221,
   Documents: 3,
   Frames: 2,
   JSEventListeners: 2,
   Nodes: 4116,
   LayoutCount: 3,
   RecalcStyleCount: 2,
   LayoutDuration: 0.136179,
   RecalcStyleDuration: 0.027681,
   ScriptDuration: 0.188817,
   TaskDuration: 0.563811,
   JSHeapUsedSize: 2959520,
   JSHeapTotalSize: 5132288
}
我能找到的关于这些数字的唯一文档是 puppeteer's documentation
基本上是这样的:
- Timestamp The timestamp when the metrics sample was taken.
- Documents Number of documents in the page.
- Frames Number of frames in the page.
- JSEventListeners Number of events in the page.
- Nodes Number of DOM nodes in the page.
- LayoutCount Total number of full or partial page layout.
- RecalcStyleCount Total number of page style recalculations.
- LayoutDuration Combined durations of all page layouts.
- RecalcStyleDuration Combined duration of all page style recalculations.
- ScriptDuration Combined duration of JavaScript execution.
- TaskDuration Combined duration of all tasks performed by the browser.
- JSHeapUsedSize Used JavaScript heap size.
- JSHeapTotalSize Total JavaScript heap size.
我真的很想获得有关这些数字的更多详细信息,特别是要回答这些问题:
最佳答案
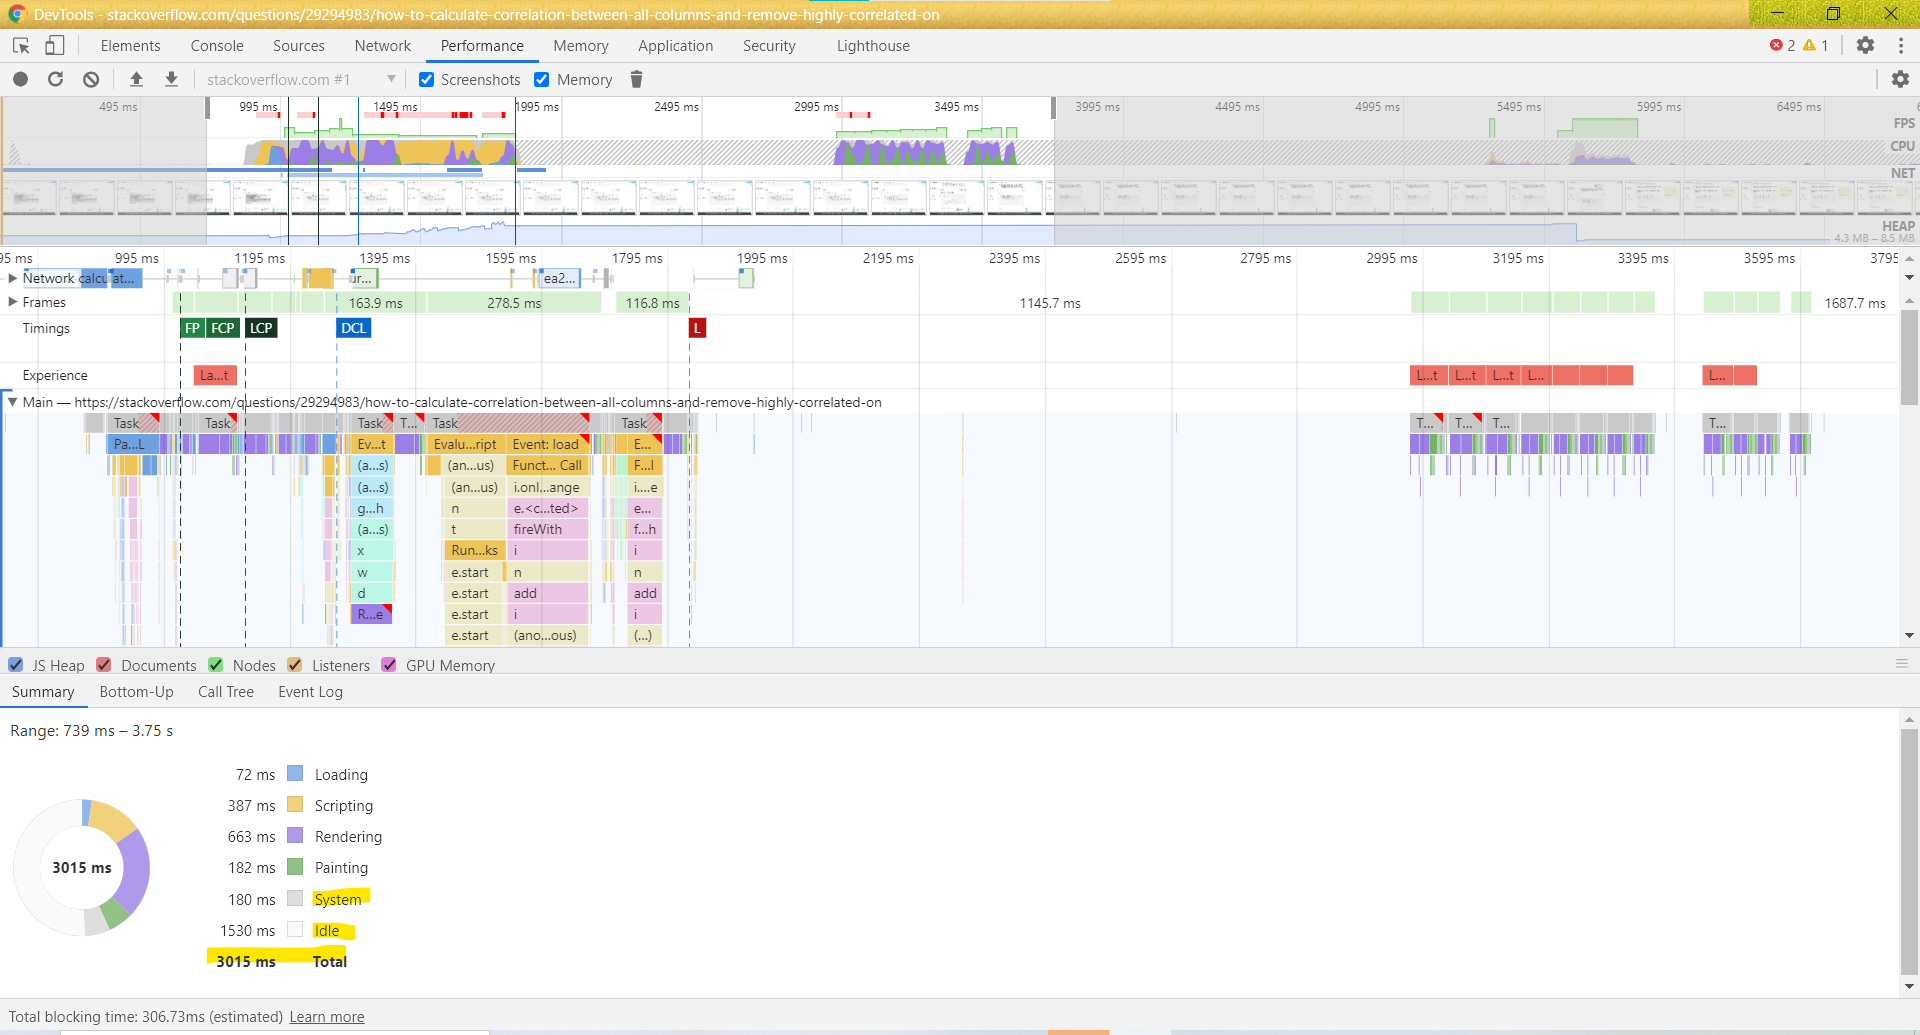
作为第一个问题的答案,Chrome 还计算系统时间和空闲时间(在 Devtools 的性能选项卡上可见),并且还计算了总时间。
我不确定系统和空闲时间的衡量标准,但我在下面的屏幕截图中看到了它:
chrome devtools performance tab screenshot
关于google-chrome-devtools - 了解 Chrome DevTools Performance.getMetrics() 结果,我们在Stack Overflow上找到一个类似的问题: https://stackoverflow.com/questions/53723263/