我很高兴地发现我可以通过添加 key_glyph = draw_key_rect 来更改图例中使用的字形。到我的几何层。我想让图例更宽更短,以类似于此 map 中的图例 Timo Grossenbacher :
我试过调整 scale_fill_manual(guide = guide_legend(keyheight = unit(0.01, units = "mm") , keywidth = unit(40, units = "mm")))这改变了图例的尺寸,但似乎只有当我把字形变大时才起作用。我似乎无法使键高更小。
有没有更好的方法来调整图例字形的尺寸?
此处简化代码:
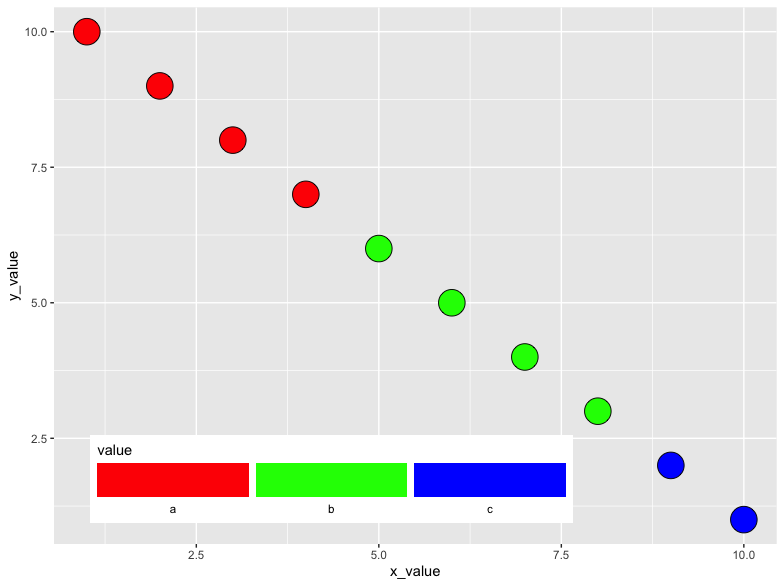
df <- data_frame(x_value = c(1:10),
                 y_value = c(rev(1:10)),
                 value = c("a","a","a","a","b","b","b","b","c","c"))
library(ggplot2)

ggplot(data = df) +
  geom_point(aes(x_value, y_value, fill = value),
             shape = 21,
             size = 9,
             key_glyph = draw_key_rect) +
  theme(legend.justification = c(0,0), # set which corner of legend legen.position references
        legend.position = c(0.05, 0.04)) +
  scale_fill_manual(values = c("red", "green", "blue"),
                    guide = guide_legend(direction = "horizontal",
                                         keyheight = unit(0.01, units = "mm"),
                                         keywidth = unit(40, units = "mm"),
                                         title.position = 'top',
                                         label.position = "bottom"))
最佳答案
You could create a fake legend .或者这里是另一个温和的解决方案。
问题似乎是 geom_point 中的大小参数,因此您可以制作虚假的美学,特别是使用线条,例如像这样:
geom_line(alpha = 0) ) geom_line 制作颜色图例与您的填充颜色相同。 override.aes ) theme 中控制图例高度library(ggplot2)
df <- data.frame(x_value = c(1:10),
y_value = c(rev(1:10)),
value = c("a","a","a","a","b","b","b","b","c","c"))
ggplot(data = df) +
geom_point(aes(x_value, y_value, fill = value), shape = 21, size = 7,
show.legend = FALSE) + # remove fill legend
geom_line(aes(x_value, y_value, color = value),
alpha = 0, #invisible line. If your data is big, you could create a very small data frame for that
key_glyph = draw_key_rect) +
theme(legend.justification = c(0,0),
legend.position = c(0.05, 0.04),
legend.key.height = unit(0.1, 'in')) + # control height
scale_fill_manual(values = c("red", "green", "blue")) +
scale_color_manual(values = c("red", "green", "blue")) +
guides(color = guide_legend(override.aes = list(alpha = 1), # make line visible in legend
direction = "horizontal",
keywidth = unit(20, units = "mm"),
title.position = 'top',
label.position = "bottom"))

创建于 2020-02-20 由 reprex package (v0.3.0)
另一种选择是删除您的
key_glyph使用 size 参数和控制字形高度参数在 geom_line
关于r - 调整 key_glyph ggplot 生成的图例字形的高度和宽度,我们在Stack Overflow上找到一个类似的问题: https://stackoverflow.com/questions/60310777/