我正在尝试编写一个可以为我做散点图的函数,
我正在使用的数据结构如下:
'data.frame':   129 obs. of  15 variables:
 $ Player      : Factor w/ 129 levels "Abbrederis, Jared",..: 1 2 3 4 5 6 7 8 9 10 ...
 $ College     : Factor w/ 79 levels "Alabama","Arizona",..: 78 20 65 77 27 48 67 31 31 19 ...
 $ Position    : Factor w/ 7 levels "DB","LB","OL",..: 7 7 6 4 4 4 2 2 7 7 ...
 $ OverallGrade: num  5.2 5.96 5.4 5.16 5.45 5.1 6.6 5.37 5.9 6.4 ...
 $ Height      : int  73 73 77 70 68 73 77 73 71 77 ...
 $ ArmLength   : num  31.4 32.6 34 31.2 31 ...
 $ Weight      : int  195 212 265 225 173 218 255 237 198 240 ...
 $ HandLength  : num  9.62 9 9 9.5 8.88 ...
 $ Dash40      : num  4.5 4.56 4.74 4.82 4.26 4.48 4.66 4.64 4.43 4.61 ...
 $ BenchPress  : int  4 14 28 20 20 19 15 22 7 13 ...
 $ VerticalJump: num  30.5 39.5 33 29.5 38 38 34.5 35 38.5 32.5 ...
 $ BroadJump   : int  117 123 118 106 122 121 119 123 122 119 ...
 $ Cone3Drill  : num  6.8 6.82 7.42 7.24 6.86 7.07 6.82 7.24 6.69 7.33 ...
 $ Shuttle20   : num  4.08 4.3 4.3 4.49 4.06 4.46 4.19 4.35 3.94 4.39 ...
 $ Position1   : Factor w/ 7 levels "WO","DB","S",..: 1 1 6 4 4 4 5 5 1 1 ...
  ..- attr(*, "scores")= num [1:7(1d)] 4.54 4.75 5.22 4.59 4.58 ...
  .. ..- attr(*, "dimnames")=List of 1
  .. .. ..$ : chr  "DB" "LB" "OL" "RB" ...
我设法在不编写函数的情况下进行绘制,并且代码可以正常工作:
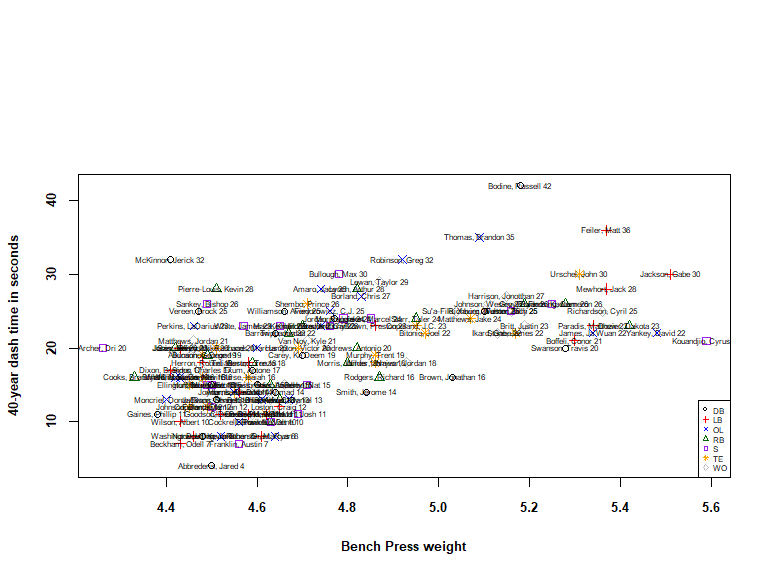
with(nfl,plot(nfl$Dash40,nfl$BenchPress,
              pch=c(1,3,4,2,0,8,5),
              col=c("black","red","blue","darkgreen","purple","orange","gray"),
              xlab = "Bench Press weight",
              ylab="40-year dash time in seconds"),
              panel.first = grid())
legend("bottomright", legend=levels(nfl$Position),
       pch=c(1,3,4,2,0,8,5),
       cex=0.5,
       col=c("black","red","blue","darkgreen","purple","orange","gray"))
a<-paste(nfl$Player,nfl$BenchPress)
text(nfl$Dash40,nfl$BenchPress,label=as.character(a),cex=0.5)
因此,基本上,我想查看不同数值变量之间的关系,并且我认为,如果上面的代码有效,则以下函数也应该起作用,
myplot<-function(xvar,yvar,xlab,ylab){
  b<-paste("xlab","vs","ylab")
  xvar<-nfl$"xvar"
  yvar<-nfl$"yvar"
  with(nfl,plot(yvar,xvar),
                pch=c(1,3,4,2,0,8,5),
                col=c("black","red","blue","darkgreen","purple","orange","gray"),
                xlab="xlab",ylab="ylab",
                main="b")
}

myplot(Dash40,BenchPress,dash,bench)
我使用Dash40和BenchPress来测试该功能,但事实证明该功能不起作用:
Error in plot.window(...) : need finite 'xlim' values
In addition: Warning messages:
1: In min(x) : no non-missing arguments to min; returning Inf
2: In max(x) : no non-missing arguments to max; returning -Inf
3: In min(x) : no non-missing arguments to min; returning Inf
4: In max(x) :
 Show Traceback

 Rerun with Debug
 Error in plot.window(...) : need finite 'xlim' values
本质上,我正在尝试使用两个不同的代码来完成相同的工作,为什么第二个代码不起作用?有人可以给我一些解决问题的障碍吗?
最佳答案
我对您的职务感到非常困惑。为什么它的参数xvar,yvar不用使用就可以覆盖?nfl$"xvar"和nfl$"yvar"是什么意思?
自从您随后使用with(nfl,...以来,为什么要这样做呢?
如果nfl没有名为xvar或yvar的列,则它们将导致错误或被解释为NULL;如果绘制NULL,则需要指定图表的界限,因为无法从数据中找到该界限。
该函数失败,因为正在绘制NULL
您还需要将数据从nfl传递给函数,因为存在这样的危险,即找不到Dash40和BenchPress,因为它们仅存在于nfl中。为此,请使用$符号。您应该将BenchPress传递给函数,而不是nfl$BenchPress。
下面应该工作。
myplot<-function(xvar,yvar,xlab,ylab){
  b<-paste(xlab,"vs",ylab)
  plot(yvar,xvar,
                pch=c(1,3,4,2,0,8,5),
                col=c("black","red","blue","darkgreen","purple","orange","gray"),
                xlab=xlab,ylab=ylab,
                main=b)
}

myplot(nfl$Dash40,nfl$BenchPress,"dash","bench")
关于r - 如何解决R中 “Error in plot.window(…) : need finite ' xlim'值的问题,我们在Stack Overflow上找到一个类似的问题: https://stackoverflow.com/questions/52557603/