是否可以使用 ggraph::geom_edge_link() 在边缘的中间绘制箭头,如果是这样,如何做到这一点?
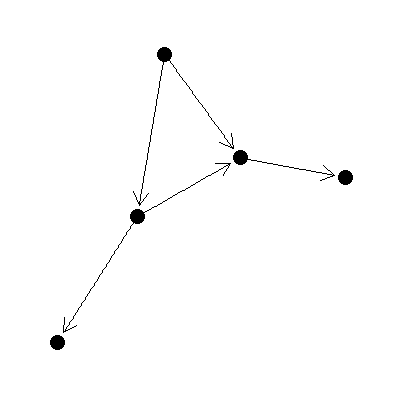
而不是像这样在边缘的末端绘制箭头:
library(ggraph)
library(tidygraph)
library(dplyr)

create_notable('bull') %>%
  ggraph(layout = 'graphopt') +
  geom_edge_link(arrow = arrow(length = unit(4, 'mm')),
                 end_cap = circle(3, 'mm')) +
  geom_node_point(size = 5) +
  theme_graph()
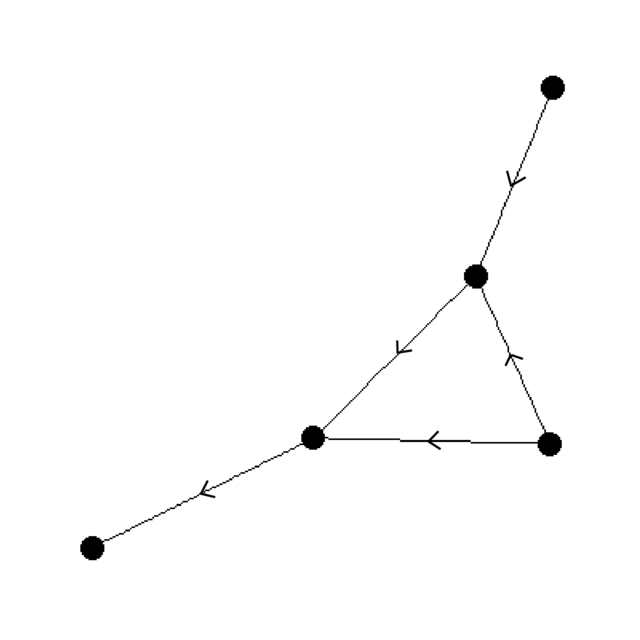
我希望能够实现这样的目标:
我查了
ggraph::geom_edge_link()和 grid::arrow()文档,但看不到任何关于如何执行此操作的明显信息。
最佳答案
我自己没有用过ggraph包,但是根据我对底层grob的理解,可以尝试以下操作:
步骤 1 .在控制台中运行以下行:
trace(ggraph:::cappedPathGrob, edit = TRUE)
步骤 2 .在弹出窗口中,更改最后一段代码:
if (is.null(start.cap) && is.null(end.cap)) {
  if (constant) {
    grob(x = x, y = y, id = id, id.lengths = NULL, arrow = arrow,
         name = name, gp = gp, vp = vp, cl = "polyline")
  }
  else {
    grob(x0 = x[!end], y0 = y[!end], x1 = x[!start],
         y1 = y[!start], id = id[!end], arrow = arrow,
         name = name, gp = gp, vp = vp, cl = "segments")
  }
} else {
  gTree(x = x, y = y, id = id, arrow = arrow, constant = constant,
        start = start, end = end, start.cap = start.cap,
        start.cap2 = start.cap2, start.captype = start.captype,
        end.cap = end.cap, end.cap2 = end.cap2, end.captype = end.captype,
        name = name, gp = gp, vp = vp, cl = "cappedpathgrob")
}
对此:
if(is.null(arrow)) {
  # same code as before, if no arrow needs to be drawn
  if (is.null(start.cap) && is.null(end.cap)) {
    if (constant) {
      grob(x = x, y = y, id = id, id.lengths = NULL, arrow = arrow,
           name = name, gp = gp, vp = vp, cl = "polyline")
    }
    else {
      grob(x0 = x[!end], y0 = y[!end],
           x1 = x[!start], y1 = y[!start],
           id = id[!end], arrow = arrow,
           name = name, gp = gp, vp = vp, cl = "segments")
    }
  } else {
    gTree(x = x, y = y, id = id, arrow = arrow, constant = constant,
          start = start, end = end, start.cap = start.cap,
          start.cap2 = start.cap2, start.captype = start.captype,
          end.cap = end.cap, end.cap2 = end.cap2, end.captype = end.captype,
          name = name, gp = gp, vp = vp, cl = "cappedpathgrob")
  }
} else {
  # split x/y/ID values corresponding to each ID into two halves; first half to
  # end with the specified arrow aesthetics; second half (with a repetition of the
  # last value from first half, so that the two halves join up) has arrow set to NULL.
  id.split = split(id, id)
  id.split = lapply(id.split,
                    function(i) c(rep(TRUE, ceiling(length(i)/2)),
                                  rep(FALSE, length(i) - ceiling(length(i)/2))))
  id.split = unsplit(id.split, id)
  id.first.half = which(id.split == TRUE)
  id.second.half = which(id.split == FALSE |
                           (id.split == TRUE & c(id.split[-1], FALSE) == FALSE))

  if (is.null(start.cap) && is.null(end.cap)) {
    if (constant) {
      gList(grob(x = x[id.first.half], y = y[id.first.half], id = id[id.first.half],
                 id.lengths = NULL, arrow = arrow,
                 name = name, gp = gp, vp = vp, cl = "polyline"),
            grob(x = x[id.second.half], y = y[id.second.half], id = id[id.second.half],
                 id.lengths = NULL, arrow = NULL,
                 name = name, gp = gp, vp = vp, cl = "polyline"))

    }
    else {
      # I haven't modified this chunk as I'm not familiar with ggraph,
      # & haven't managed to trigger constant == FALSE condition yet
      # to test out code modifications here
      grob(x0 = x[!end], y0 = y[!end],
           x1 = x[!start], y1 = y[!start],
           id = id[!end], arrow = arrow,
           name = name, gp = gp, vp = vp, cl = "segments")
    }
  } else {
    gList(gTree(x = x[id.first.half], y = y[id.first.half], id = id[id.first.half],
                arrow = arrow, constant = constant,
                start = start, end = end, start.cap = start.cap,
                start.cap2 = start.cap2, start.captype = start.captype,
                end.cap = end.cap, end.cap2 = end.cap2, end.captype = end.captype,
                name = name, gp = gp, vp = vp, cl = "cappedpathgrob"),
          gTree(x = x[id.second.half], y = y[id.second.half], id = id[id.second.half],
                arrow = NULL, constant = constant,
                start = start, end = end, start.cap = start.cap,
                start.cap2 = start.cap2, start.captype = start.captype,
                end.cap = end.cap, end.cap2 = end.cap2, end.captype = end.captype,
                name = name, gp = gp, vp = vp, cl = "cappedpathgrob"))
  }
}
步骤 3 .正常运行 ggraph 代码:
set.seed(777) # set seed for reproducibility

create_notable('bull') %>%
  ggraph(layout = 'graphopt') +
  geom_edge_link(arrow = arrow(length = unit(4, 'mm')),
                 end_cap = circle(0, 'mm')) +
  geom_node_point(size = 5) +
  theme_graph()

# end_cap parameter has been set to 0 so that the segments join up;
# you can also refrain from specifying this parameter completely.

在您当前的 R session 的其余部分中,此效果将保持不变(即
ggraph 创建的所有带箭头的段的箭头都在中间而不是末尾),直到您运行以下行:untrace(ggraph:::cappedPathGrob)
此后,将恢复正常行为。
关于r - 如何在ggraph中的边缘中间绘制箭头,我们在Stack Overflow上找到一个类似的问题: https://stackoverflow.com/questions/58227181/