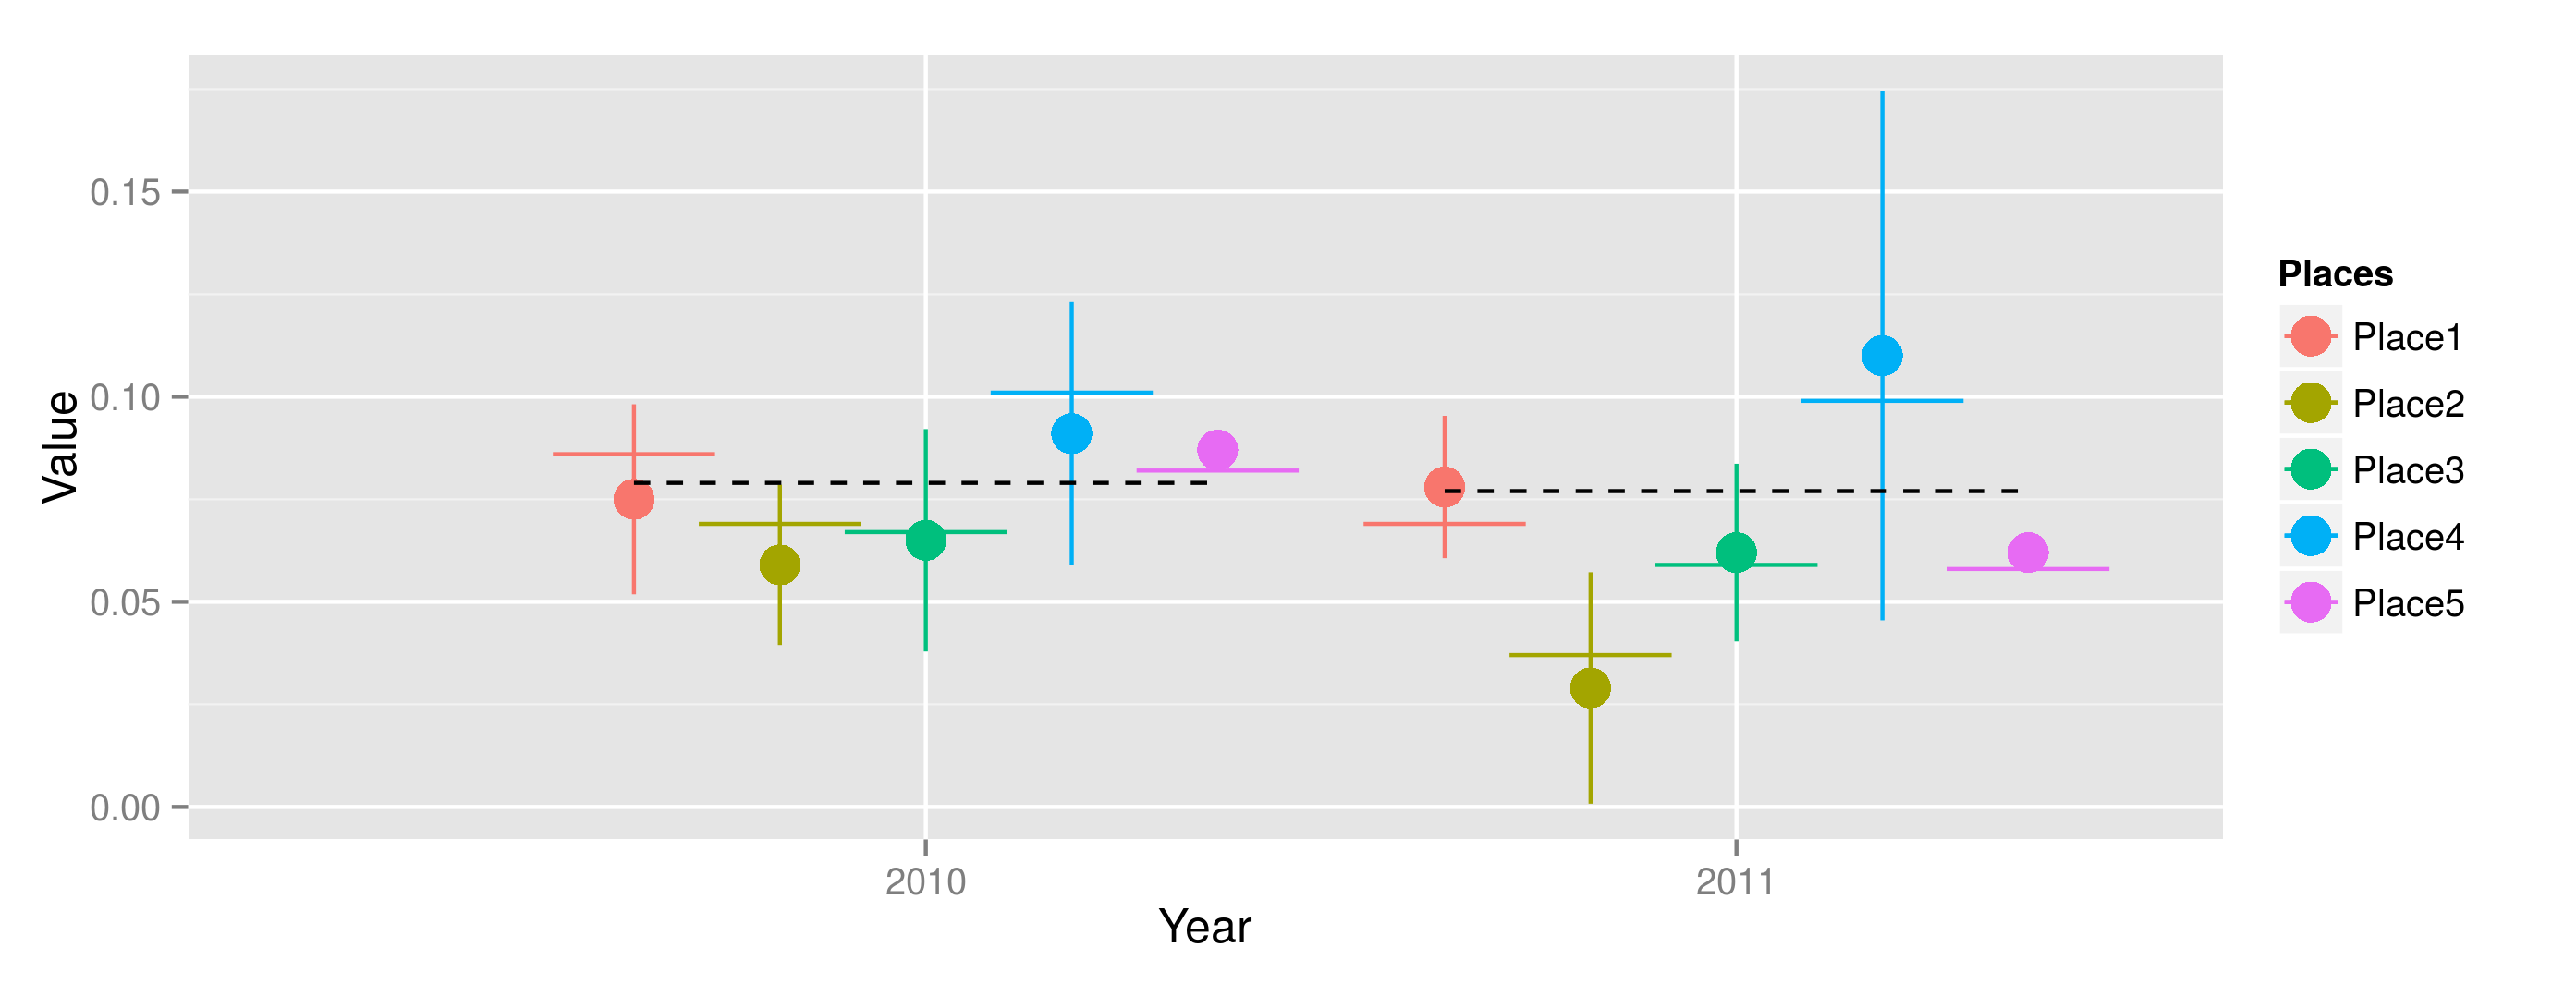
我用点和误差条绘制每个位置的观测值,这按预期工作。
问题:
我还尝试将每个位置的预期 值绘制为一条短水平线,以与点相同的方式居中。我为此使用了线段,线条出现了,但它们没有居中,我不知道如何控制它们。
我想绘制所有地方每年都相同但每年都在变化的引用值。我得到了带有 geom_line 的线,但它是倾斜的,我想有步骤(或有中断的两条线)。使用 geom_steps 我得到每个地方的垂直移动,而不是每年。我尝试了
geom_hline以及用hline.data<-data.frame(hy=chunk$Reference.Value, hx=chunk$Year)定义一个 data.frame a 在整个地 block 上得到两条平行线。
你能告诉我我做错了什么吗? 非常感谢您!
我尝试的代码:
library(data.table)
library(ggplot2)

chunk<-fread("
Year;Places;Code;Name;Reference.Value;Value;Expected.Value;CI
2010;Place5;A12;Indicator;0.079;0.087;0.082;0.00286
2010;Place1;A12;Indicator;0.079;0.075;0.086;0.02317
2010;Place2;A12;Indicator;0.079;0.059;0.069;0.01955
2010;Place3;A12;Indicator;0.079;0.065;0.067;0.02712
2010;Place4;A12;Indicator;0.079;0.091;0.101;0.03211
2011;Place5;A12;Indicator;0.077;0.062;0.058;0.00260
2011;Place1;A12;Indicator;0.077;0.078;0.069;0.01736
2011;Place2;A12;Indicator;0.077;0.029;0.037;0.02821
2011;Place3;A12;Indicator;0.077;0.062;0.059;0.02166
2011;Place4;A12;Indicator;0.077;0.110;0.099;0.06452")

chunk[,`:=` (Year     = as.factor(Year),
               Places   = as.factor(Places),
               Code     = as.factor(Code),
               Name     = as.factor(Name)
)]

limits <- aes(ymax = Value+CI, ymin=Value-CI)
dodge <- position_dodge(width=0.9)

p <- ggplot(chunk, aes(colour=Places, fill=Places, y=Value, x=Year))

p + geom_linerange(limits, position=dodge) +
geom_point(position=dodge, size = 5) +
geom_segment(position=dodge,
           aes(group=Places,
               y=Expected.Value, yend=Expected.Value,
               x=as.numeric(Year)-0.01, xend=as.numeric(Year)+0.01)
) +
geom_line(position=dodge, aes(group=Places, y=Reference.Value,x=Year),   color="black")
# geom_step(position=dodge, direction="vh", aes(group=Places,y=Reference.Value,x=Year), color="black")
最佳答案
这是我的解释。您可以获得“闪避”偏移量并将其用于线段的开头/结尾。所有 geom 中的 group 将是 Year,由 dodge 确定的偏移量只是说明 Place 因素应该离该分组有多远。
## Get offsets for dodge
dodgeWidth <- 0.9
nFactors <- length(levels(chunk[,Places]))
chunk[, `:=` (dPlaces = (dodgeWidth/nFactors)*(as.numeric(Places) - mean(as.numeric(Places))))]

limits <- aes(ymax = Value+CI, ymin=Value-CI)
dodge <- position_dodge(width=0.9)
p <- ggplot(chunk, aes(colour=Places, fill=Places, y=Value, x=Year))

p + geom_linerange(limits, position=dodge) +
  geom_point(position=dodge, size = 5) +
  geom_segment(position=dodge, aes(y=Expected.Value, yend=Expected.Value,
                   x=as.numeric(Year)+dPlaces-0.1, xend=as.numeric(Year)+dPlaces+0.1)) +
  geom_step(aes(group=Year, y=Reference.Value,
                x=as.numeric(Year)+dPlaces), color="black", linetype=2)
关于r - 如何在 R 中绘制期望值和引用值?,我们在Stack Overflow上找到一个类似的问题: https://stackoverflow.com/questions/30964442/