导出 KML 以在 Google map 中使用。这是要导出的代码(改编自 here ):
t_expkml_c <- function(obj, archivo,
                     col_nombre, col_desc, col_color,
                     mapa_colores = "mapa_colores_topaz",
                     mapa_nombre = "Mapa_TSE", mapa_desc = "Mapa Creado por PE de TSE") {

  # - changes projection
  if (proj4string(obj)!="+proj=longlat +ellps=WGS84 +datum=WGS84 +no_defs +towgs84=0,0,0") {
    cat("Input SpatialPolygonsDataFrame ",obj," re-projected from ",
        proj4string(obj)," to WGS84 longlat\n",sep="")
    assign(obj,spTransform(obj,CRS(" +proj=longlat +ellps=WGS84 +datum=WGS84 +no_defs +towgs84=0,0,0")))
  } # check projection

  # opens file
  kmlFile <- file(archivo,
                  open = "w")

  # goes through each polygon
  # usa maptools::kmlPolygon
  Xout <- sapply(slot(obj,
                      "polygons"),
                 function(x) {
                   maptools::kmlPolygon(x, # Object
                                        name = as(obj, "data.frame")[slot(x, "ID"), col_nombre],
                                        # name column
                                        col = mapa_colores[as.numeric(as(obj, "data.frame")[slot(x, "ID"), col_color])],
                                        # color column
                                        lwd = 0.5, # stroke
                                        border = NA, # borders
                                        visibility = TRUE,
                                        description = as(obj,"data.frame")[slot(x, "ID"), col_desc], #description (what I need to change)
                   )
                 }
  )

  # export polyon out
  cat(kmlPolygon(kmlname=mapa_nombre,
                 kmldescription=mapa_desc)$header,
      file = kmlFile, sep="\n")
  # estilos
  cat(unlist(Xout["style",]),
      file = kmlFile, sep="\n")
  # contenidos
  cat(unlist(Xout["content",]),
      file = kmlFile, sep="\n")
  # footers
  cat(kmlPolygon()$footer,
      file = kmlFile, sep="\n")
  close(kmlFile) # end
}
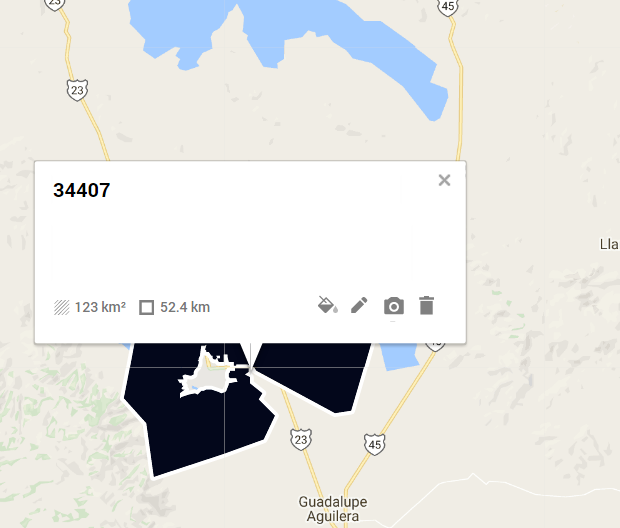
kmlmap@data 中的一列时,这可以正常工作data.frame (对象是类 SpatialPolygonsDataFrame )。但是,我想导出一个更大的数据表,以便它可以出现在 Google Maps 形状的描述中。例如,这是一列(原始导出);
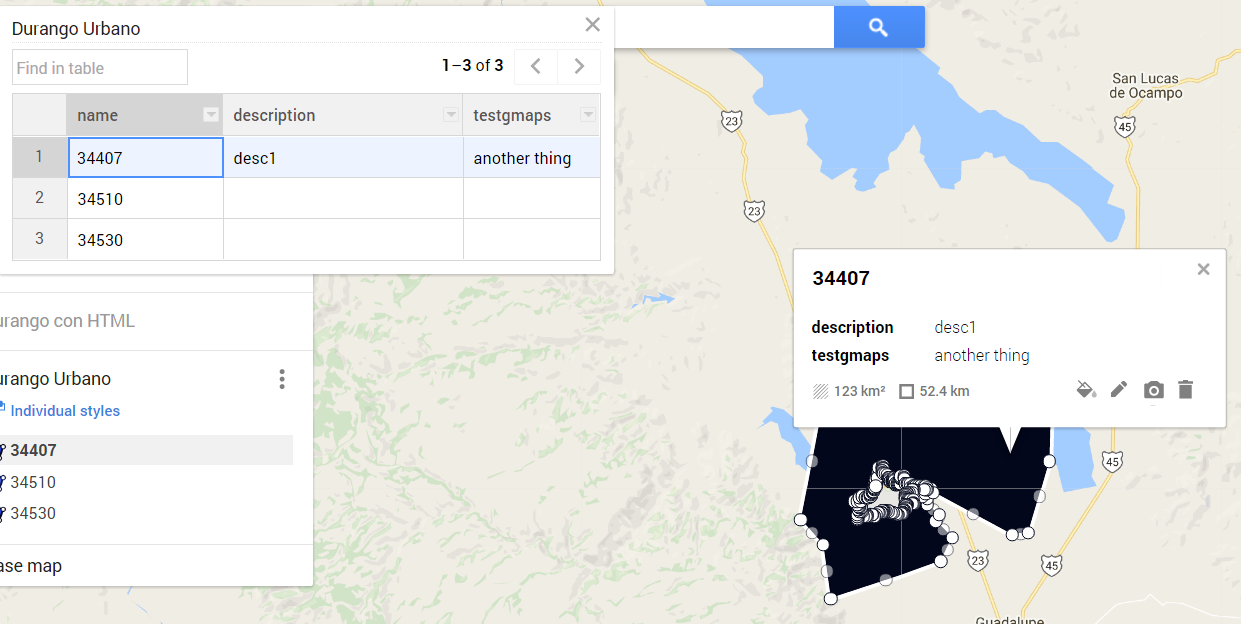
如果我想添加其他描述符,我将谷歌地图中的数据表更改如下:
但我想从 R 中的原始导出复制此行为。我试图更改
description参数来添加向量列名甚至列名索引(即 c("Column2", "Column3") 或 1:2 ),我试图将 HTML 添加到描述列(在谷歌地图数据表中可视化时不起作用显然不同的列)。我怎样才能做到这一点?
最佳答案
您必须使用 HTML 并将列连接在一起。
sc<- c(103.8259077,1.320045,103.8265944,1.3143817,103.829813,1.3132662, 103.8346624,1.3173421,103.8259077,1.320045)
polys_coords<-list()
polys_coords[[1]]<-matrix(sc,  byrow=TRUE, ncol=2)
polys_coords[[2]]<-polys_coords[[1]]+0.05
polys_coords[[3]]<-polys_coords[[1]]-0.05
polys_spatial<-SpatialPolygons(
  Srl= list ( Polygons( srl=lapply(polys_coords, function(x) Polygon(x)), ID="1"),
              Polygons( srl=lapply(polys_coords, function(x) Polygon(x-0.01)), ID="2"),
              Polygons( srl=lapply(polys_coords, function(x) Polygon(x+0.01)), ID="3"))
)
proj4string(polys_spatial)<-CRS(" +proj=longlat +ellps=WGS84 +datum=WGS84 +no_defs +towgs84=0,0,0")
df<-SpatialPolygonsDataFrame(polys_spatial, data.frame(NAME=paste0("Name",1:3), DESCA=paste0("Poly",1:3), DESCB=paste0("Gon",1:3)))
#   NAME DESCA DESCB
# 1 Name1 Poly1  Gon1
# 2 Name2 Poly2  Gon2
# 3 Name3 Poly3  Gon3

xOut<-sapply(df@polygons, function(x) kmlPolygon(x, name=as.data.frame(df)[x@ID,"NAME"],
                                                 description=paste(
                                                               sapply(2:3, function(i) {
                                                                 y<-as.data.frame(df)
                                                                 paste0("<p><strong>",colnames(y)[i], "</strong>: ", y[x@ID,i],"</p>") } ) ,
                                                              collapse=""))
)

xOut[["content",1]][1:5]
# [1] ""
# [2] "<Placemark>"
# [3] "<name>Name1</name>"
# [4] "<description><![CDATA[<p><strong>DESCA</strong>: Poly1</p><p><strong>DESCB</strong>: Gon1</p>]]></description>"
# [5] "<styleUrl>#1</styleUrl>"
xOut[["content",2]][1:5]
# [1] ""
# [2] "<Placemark>"
# [3] "<name>Name2</name>"
# [4] "<description><![CDATA[<p><strong>DESCA</strong>: Poly2</p><p><strong>DESCB</strong>: Gon2</p>]]></description>"
# [5] "<styleUrl>#2</styleUrl>"
关于r - 将数据表导出到 R 中的 Google Maps KML,我们在Stack Overflow上找到一个类似的问题: https://stackoverflow.com/questions/41899327/