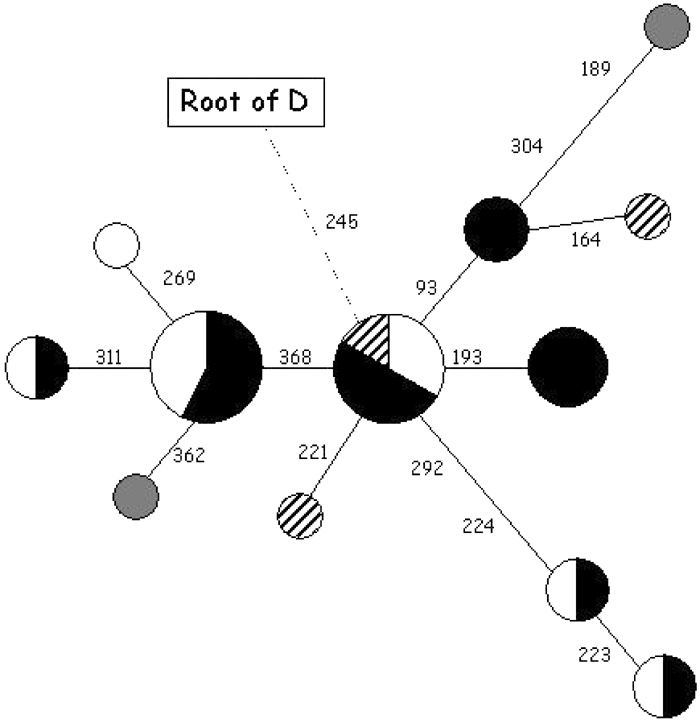
我想使用 D3.js 在 D3 力定向布局图的节点上放置饼图。这是群体遗传学中常见的可视化,参见例如 http://mathildasanthropologyblog.files.wordpress.com/2008/06/as3.jpg

我从一个非常基本的图表开始:
<!DOCTYPE html>
<html lang="en">
    <head>
        <script type="text/javascript" src="d3/d3.v3.js"></script>
    </head>
    <body>
        <script type="text/javascript">

graph = { "nodes":[{"proportions": [{"group": 1, "value": 1},
                                    {"group": 2, "value": 2},
                                    {"group": 3, "value": 3}]},
                   {"proportions": [{"group": 1, "value": 2},
                                    {"group": 2, "value": 2},
                                    {"group": 3, "value": 2}]}],
          "links":[{"source": 0, "target": 1, "length": 500, "width": 1}]
        }

var width = 960,
    height = 500,
    radius = 10,
    color = d3.scale.category20c();

var svg = d3.select("body").append("svg")
    .attr("width", width)
    .attr("height", height);

var force = d3.layout.force()
    .charge(-120)
    .size([width, height]);

force
    .nodes(graph.nodes)
    .links(graph.links)
    .start();

var link = svg.selectAll(".link")
    .data(graph.links)
  .enter().append("line")
    .attr("class", "link");

var node = svg.selectAll(".node")
    .data(graph.nodes)
  .enter().append("circle")
    .attr("class", "node")
    .attr("r", radius)
    .call(force.drag);

force.on("tick", function() {
  link.attr("x1", function(d) { return d.source.x; })
      .attr("y1", function(d) { return d.source.y; })
      .attr("x2", function(d) { return d.target.x; })
      .attr("y2", function(d) { return d.target.y; });

  node.attr("cx", function(d) { return d.x; })
      .attr("cy", function(d) { return d.y; });
});
        </script>
    </body>
</html>
但是当我尝试用饼图替换圆形节点时,饼图最终都堆积在图的角落。
<!DOCTYPE html>
<html lang="en">
    <head>
        <script type="text/javascript" src="d3/d3.v3.js"></script>
    </head>
    <body>
        <script type="text/javascript">

graph = { "nodes":[{"proportions": [{"group": 1, "value": 1},
                                    {"group": 2, "value": 2},
                                    {"group": 3, "value": 3}]},
                   {"proportions": [{"group": 1, "value": 2},
                                    {"group": 2, "value": 2},
                                    {"group": 3, "value": 2}]}],
          "links":[{"source": 0, "target": 1, "length": 500, "width": 1}]
        }

var width = 960,
    height = 500,
    radius = 10,
    color = d3.scale.category20c();

var pie = d3.layout.pie()
    .sort(null)
    .value(function(d) { return d.value; });

var arc = d3.svg.arc()
    .outerRadius(radius)
    .innerRadius(0);

var svg = d3.select("body").append("svg")
    .attr("width", width)
    .attr("height", height);

var force = d3.layout.force()
    .charge(-120)
    .size([width, height]);

force
    .nodes(graph.nodes)
    .links(graph.links)
    .start();

var link = svg.selectAll(".link")
    .data(graph.links)
  .enter().append("line")
    .attr("class", "link");

var node = svg.selectAll(".node")
    .data(graph.nodes)
  .enter().append("g")
   .attr("class", "node");

node.selectAll("path")
  .data(function(d) {return pie(d.proportions); })
 .enter().append("svg:path")
  .attr("d", arc)
  .style("fill", function(d) { return color(d.group); });;

force.on("tick", function() {
  link.attr("x1", function(d) { return d.source.x; })
      .attr("y1", function(d) { return d.source.y; })
      .attr("x2", function(d) { return d.target.x; })
      .attr("y2", function(d) { return d.target.y; });

  node.attr("x", function(d) { return d.x; })
      .attr("y", function(d) { return d.y; });
});
        </script>
    </body>
</html>
任何帮助将不胜感激!
最佳答案
问题似乎是 force-on-tick 回调中的最后一条语句:
node.attr("x", function(d) { return d.x; })
    .attr("y", function(d) { return d.y; });
SVG 路径没有这样的 x/y 属性。尝试翻译路径:
node.attr('transform', function(d) { return 'translate(' + d.x + ',' + d.y + ')'; });
关于graph - 将饼图放置在 D3 中力导向布局图的节点上,我们在Stack Overflow上找到一个类似的问题: https://stackoverflow.com/questions/14794055/